Summary:
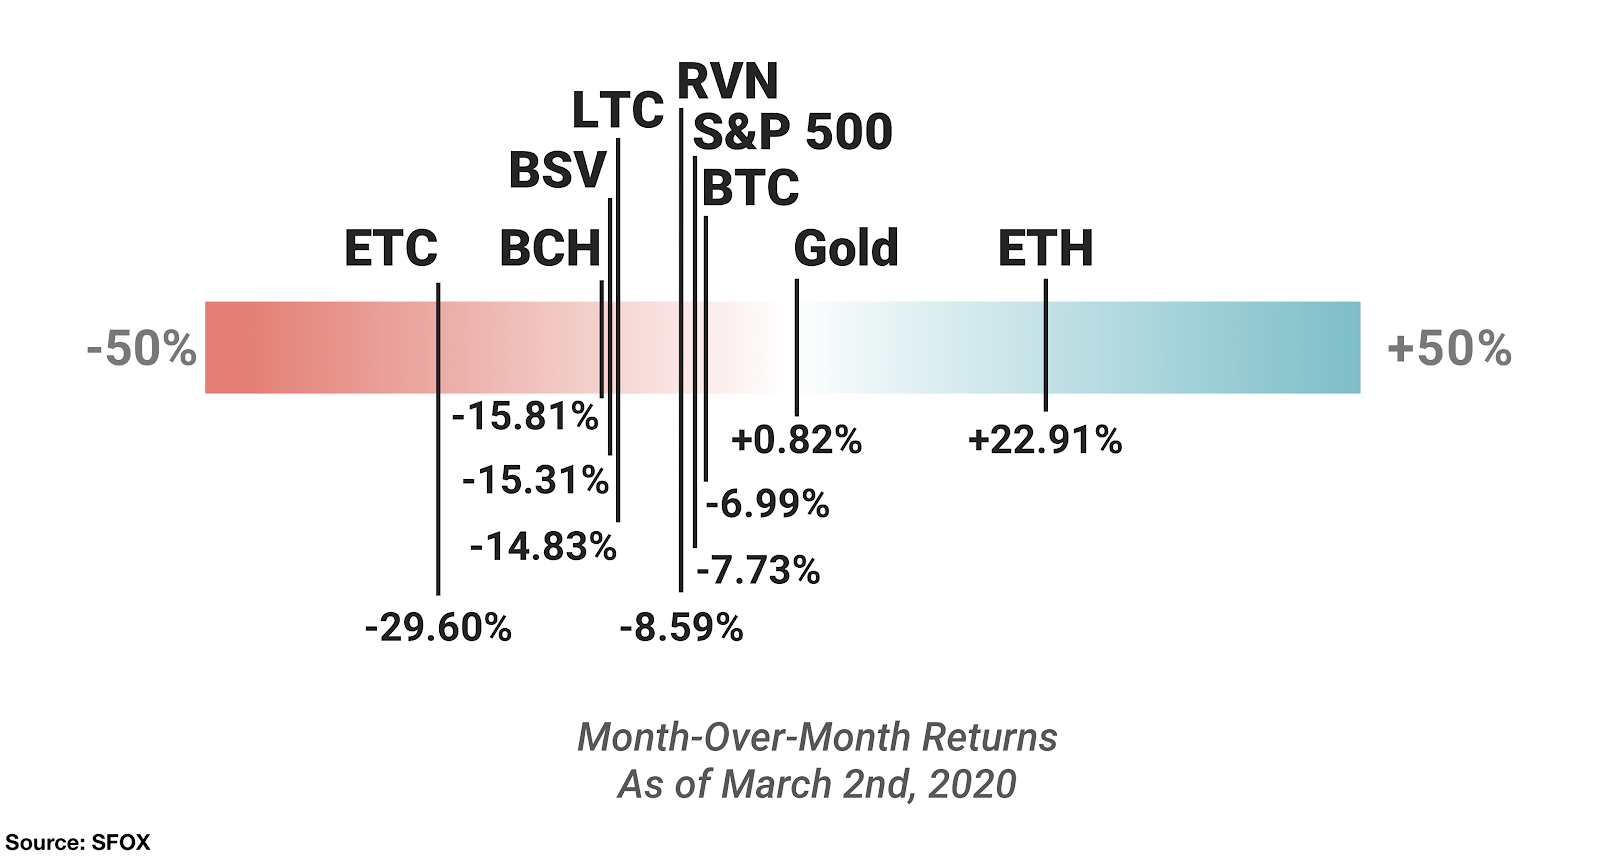
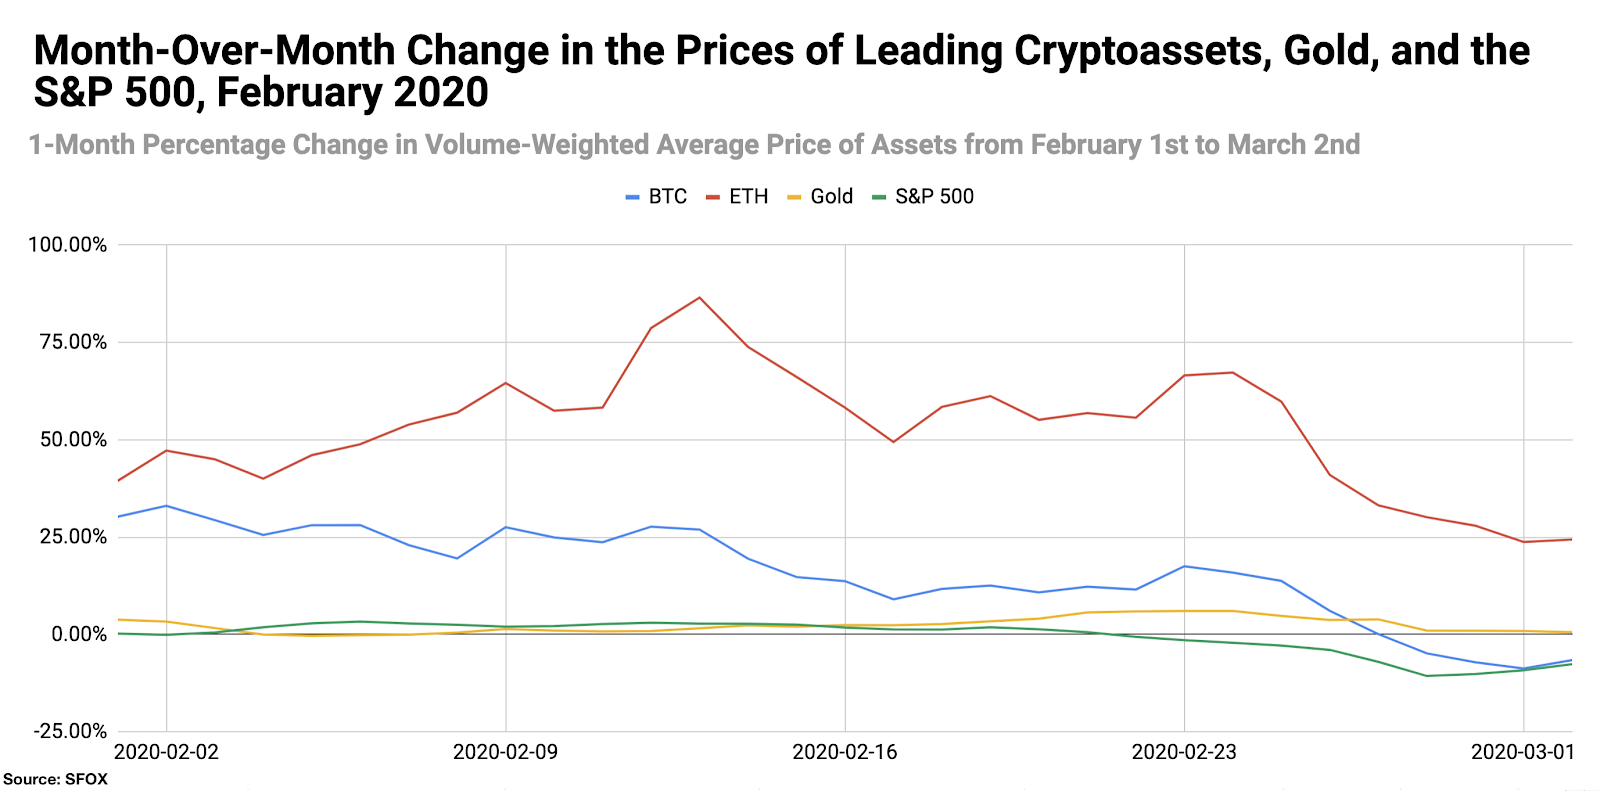
- ETH is the only crypto asset with positive month-over-month returns as of March 2nd, 2020 (+22.91%), while BTC is down 6.99% month-over-month, the S&P 500 is down 7.73% month-over-month, and gold is up 0.82% month-over-month.
- The SFOX Multi-Factor Market Index remains at neutral as of the start of March, though it is trending slightly away from the bearish direction and towards the bullish direction.
- Watch for more coronavirus/macroeconomic news, further developments in DeFi, new regulatory/tax guidance, and further news or analyses of the Bitcoin block reward halving to potentially impact the crypto market in the coming months.
In the March 2020 edition of the SFOX crypto market report, the SFOX Research Team reviews the crypto market’s volatility, correlations, and other performance metrics throughout the past month. We’ve aggregated price, volume, correlations, and volatility data from eight leading exchanges and liquidity providers to analyze the global performance of 7 major crypto assets — BTC, ETH, BCH, LTC, BSV, ETC, and RVN — all of which are available for smart-routing-powered trading on our trading platform.
The following is a report and analysis of their volatility, price correlations, and further development in the month of February. (For more information on data sources and methodology, please consult the appendix at the end of the report.)
SFOX’s Current Crypto Market Outlook: Neutral
Based on our calculations and analyses, the SFOX Multi-Factor Market Index, which was set at neutral a month ago, remains at neutral as of March 2nd — though, within the confines of that rating, it has moved away from the bearish direction of the index (-1) towards the bullish direction of the index (+1).
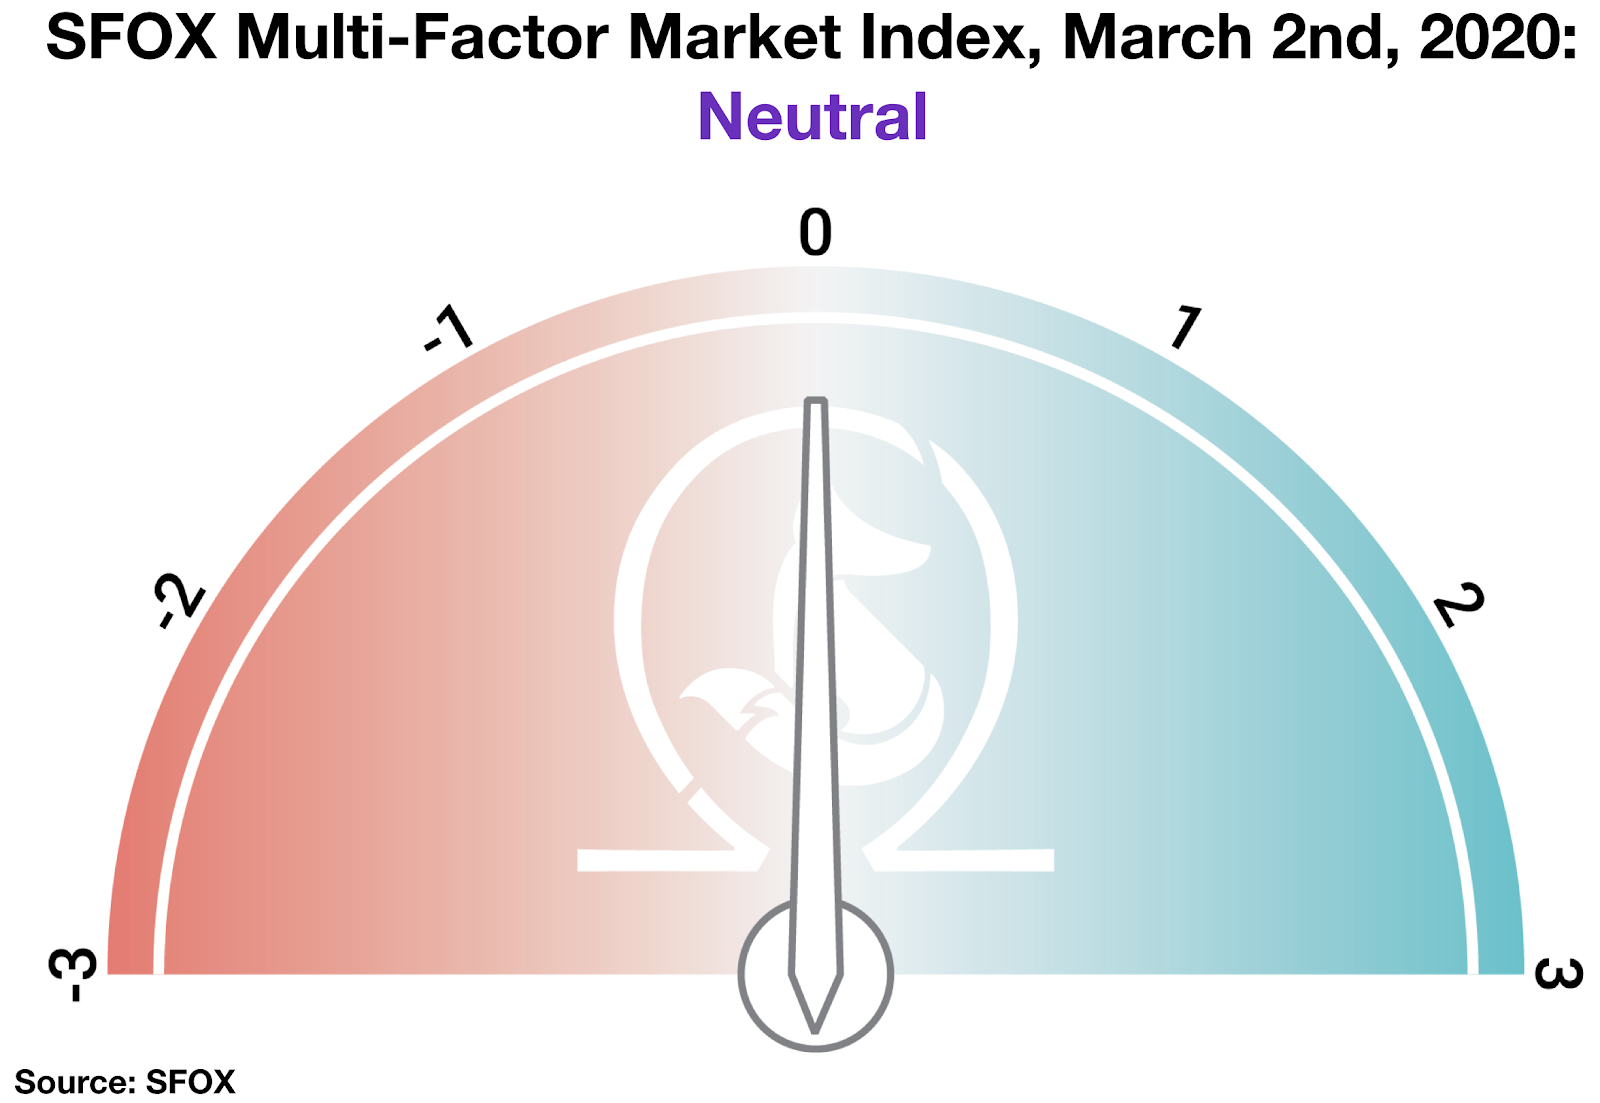
We determine the monthly value of this index by using proprietary, quantifiable indicators to analyze four market factors: price momentum, market sentiment, volatility, and continued advancement of the sector. It is calculated using a proprietary formula that combines quantified data on search traffic, blockchain transactions, and moving averages. The index ranges from highly bearish to highly bullish.
Almost all crypto assets tracked by the SFOX market report showed month-over-month losses as of March 2nd, along with the S&P 500. The exceptions were ETH, which showed month-over-month gains of 22.91%, and gold, which showed month-over-month gains of 0.81%.
With the index remaining at neutral for the fourth month in a row, several factors appear to be driving uncertainty in the trajectory of the sector. The potential impact of BTC’s upcoming block reward halving in May is a continued discussion of debate, particularly regarding whether it’s already priced in and how much mining costs will increase after it occurs. Market movements surrounding coronavirus fears also appear to have market participants reevaluating how BTC and other crypto assets fit into the macroeconomic landscape. Meanwhile, Ethereum and ETH appear to be standing out from the pack, not only in terms of the month-over-month returns of ETH, but also in terms of the growing market cap of DeFi, or credit-and-lending services built on top of the Ethereum blockchain. We assess all of these factors in more depth below.
Get the SFOX edge in volatile times through our smart-routing order types that capture the best available crypto prices from all major trading venues directly from your SFOX account.
What’s Happened in February and What to Watch in March
Markets
The price of BTC decreased along with the S&P 500 amidst coronavirus concerns (February 20th — February 28th). The leading financial story in the second half of February 2020 was speculation about the potential that a spreading coronavirus (Covid-19) could have on major companies. Corporations like Apple and Walmart warned that the coronavirus could potentially impact their Q1 earnings projections. In nine days, the S&P 500 fell almost 14%; in those same nine days, the price of BTC decreased almost 13%.
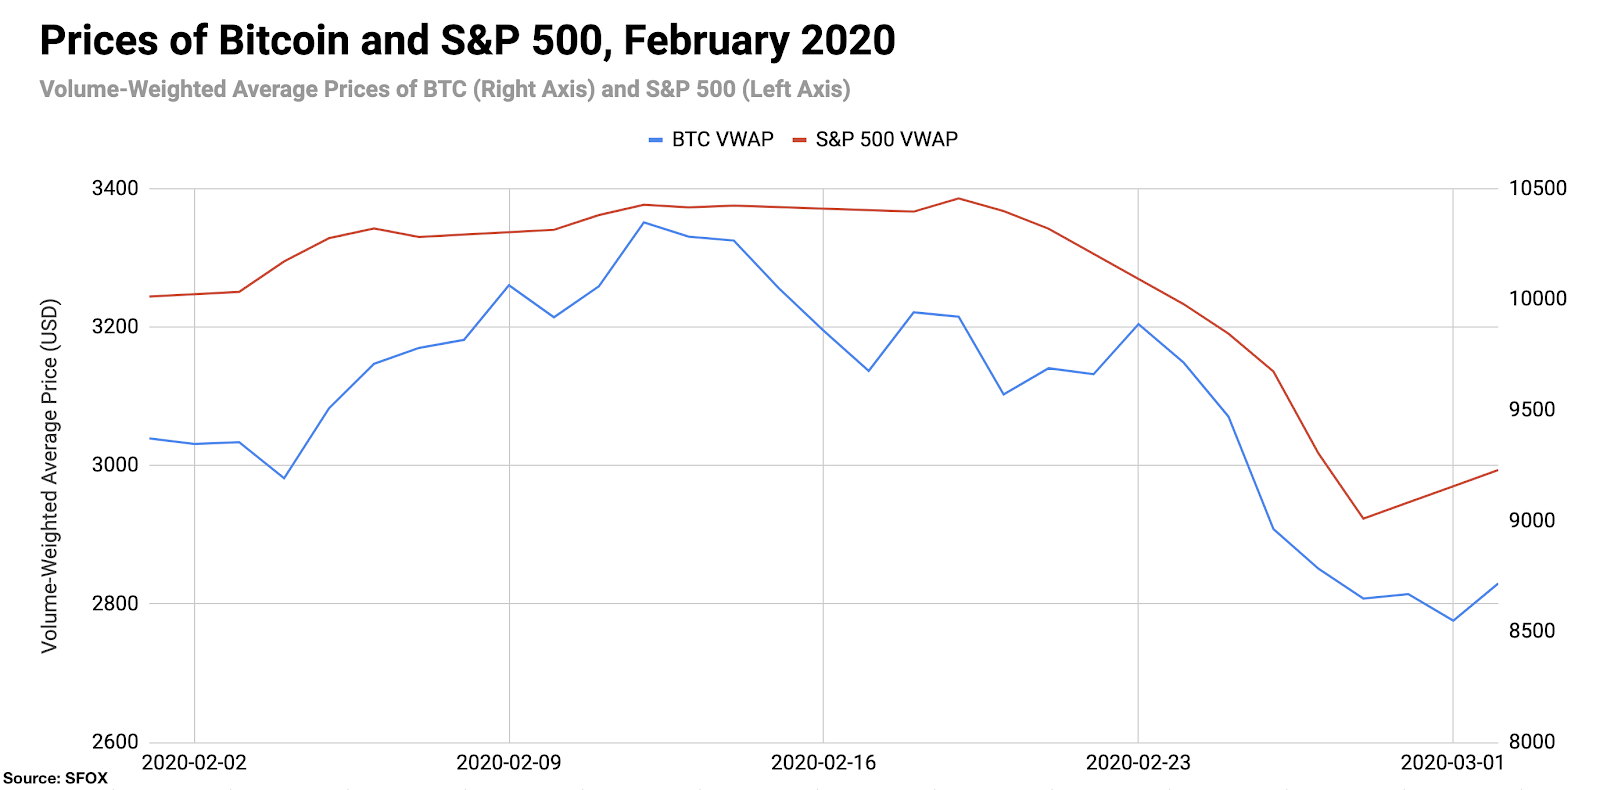
BTC’s drop in line with the S&P 500 led some to question the narrative that Bitcoin is well-suited to function as a safe haven asset like gold. Some, such as Quantum Economics founder Mati Greenspan, made the argument that this drop may reflect that BTC doesn’t function as a hedge against falling corporate profits, but rather as a hedge against “inflation, geopolitical strife, and central banks.” This theory would align with the data SFOX observed back in January 2020, when the price of BTC rose amidst U.S.-Iran tensions.
However, it’s worth noting that gold, too, saw a more modest price decrease near the end of February, falling almost 5% between February 24th and February 28th. Some analysts view this as a sign that we are simply experiencing a very strong risk-off environment, in which case traders could theoretically be selling off even those assets that are typically seen as relatively safe.
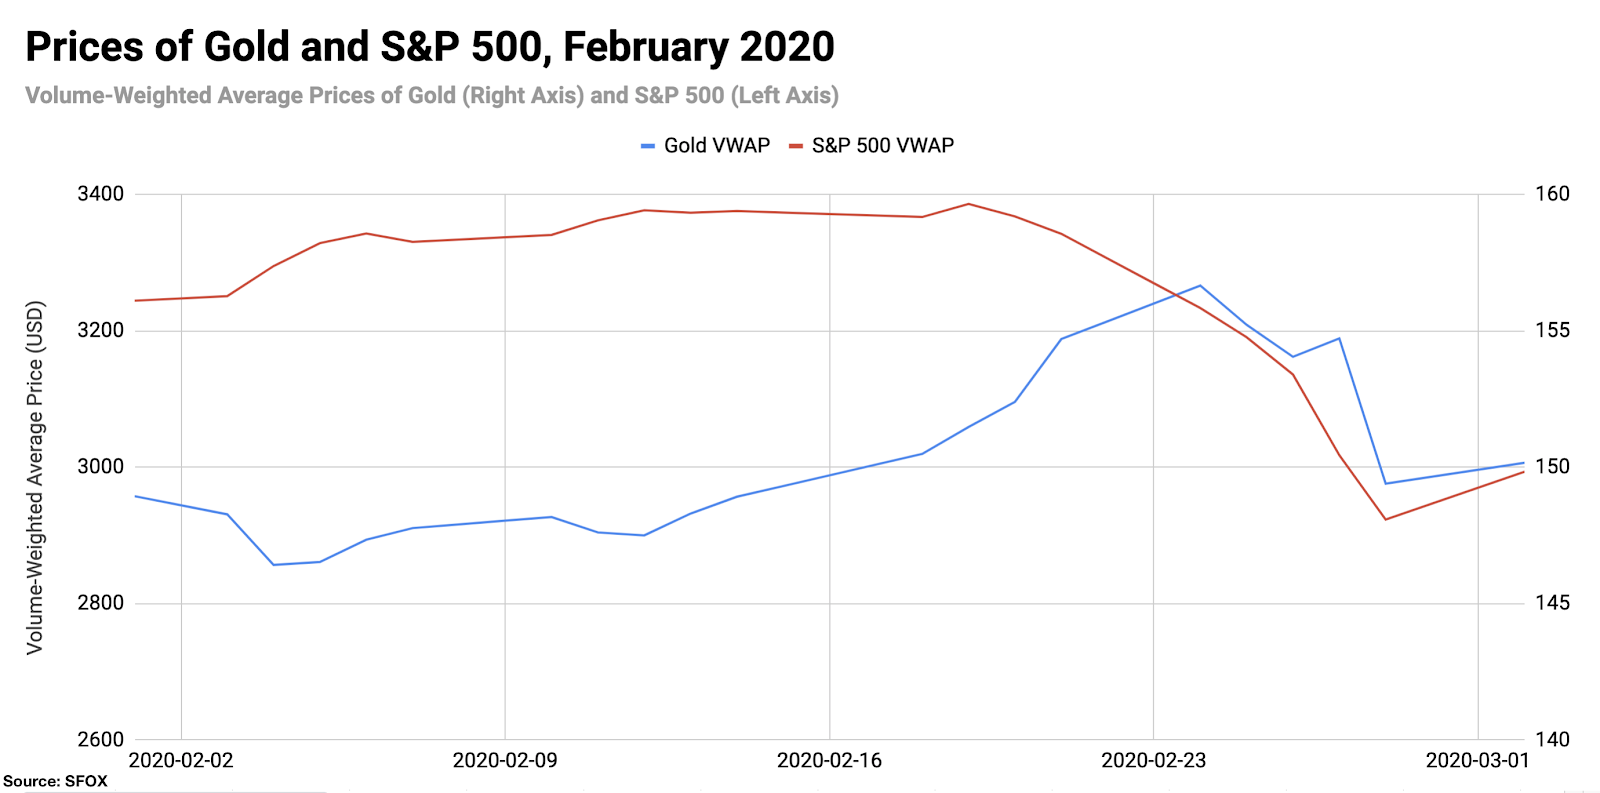
It’s important to remember that, as much as the events surrounding the coronavirus have been the focus of recent news cycles, the market movements we’re considering here are constrained to just a couple of weeks. If traders wish to assess the extent to which BTC is growing into a safe haven asset, they may wish to take a longer-term perspective and see how it behaves longitudinally across broader market corrections or periods of macro instability.
Products
The amount of capital locked in decentralized finance (“DeFi”) applications rose to $1 billion for the first time (February 7th). The amount of capital locked in Ethereum-based credit-and-lending services — a sector broadly known as “DeFi” for “decentralized finance” — reportedly reached the $1 billion milestone for the first time on February 7th, an almost 4x increase from its value a year ago ($276 million). Just 3 applications — Maker, Compound, and Synthetix — make up over 80% of DeFi’s current market cap. In a month when ETH has shown better returns than BTC and other leading crypto assets, many have pointed to DeFi as a promising emerging blockchain sector that may be worth watching as crypto continues to mature.
JPMorgan is reportedly in talks to merge its blockchain unit with Ethereum-based ConsenSys (February 11th). Unnamed sources claimed that JPMorgan is in talks to merge Quorum, its blockchain unit, with ConsenSys, an Ethereum-focused development and venture firm headed by Ethereum co-founder Joseph Lubin. Sources expect the details of the deal, which remains largely rumored at this point, to be defined within the next six months. Such a merger, involving a major traditional finance company and a major blockchain organization, could be hailed as a positive signal for the overall maturation of the crypto sector, and could help to better establish Ethereum as a DeFi-focused blockchain in conjunction with the continued growth discussed above.
Regulatory
Australian and German regulatory entities recognized cryptocurrency as financial instruments (February 27th; March 2nd). At the end of February, a New South Wales district court allowed a cryptocurrency exchange account to be used as a security for the defendant’s legal costs in a defamation case, with Judge Judith Gibson acknowledging crypto assets’ historical volatility but adding that cryptocurrency is a “recognised form of investment.” Just a few days later, the German Federal Financial Supervisory Authority issued a press release clarifying the classification of crypto as a “digital representation of a value that has not been issued or guaranteed by any central bank or public body and is not necessarily linked to a currency specified by law and that does not have the legal status of a currency or money, but is accepted as a medium of exchange by natural or legal persons and can be transmitted, stored and traded electronically.” In a time when many have been calling for clearer regulatory guidance on crypto assets, these developments may help to provide a better-defined framework for understanding the crypto asset class and allowing it to mature further.
The IRS held a summit inviting crypto advocates and leaders to discuss how they can “balance taxpayer service with regulatory enforcement” (March 3rd). Ahead of the U.S. tax season, the Internal Revenue Service put together a summit to better understand and be responsive to the current state of crypto through guidance from industry participants. Topics reportedly included the availability of blockchain transaction data, the inaccessibility of centralized exchange transaction data, and the diversity of current regulatory guidance both globally and within the U.S. A group of 8 U.S. congresspeople wrote a letter to the IRS last December explicitly asking for further regulatory guidance around cryptocurrencies; traders and investors may want to watch for the potential issuance of such guidance in the next few weeks.
Technical Developments
New highlight in the discussion surrounding the upcoming Bitcoin mining reward halving (expected in May): research firm reports new data on projected mining cost increase post-halving (February 7th; February 25th). As SFOX considered in last month’s market report, debate over the impact of the upcoming halving of the BTC block reward (due to happen this May) on BTC’s price continues to be a prominent point of debate among analysts, and may remain so up through May. This month, market research firm TradeBlock projected that the cost to mine one bitcoin after the upcoming halving could range from $12,525 to $15,062; based on their analysis that miners are continuing to invest more resources towards mining, they infer that miners may be expecting BTC’s price to increase beyond these levels after the halving.
The Details: February 2020 Crypto Price, Volatility, and Correlation Data
Price Performance: Rise and Fall
Bitcoin began February 2020 at the price of $9372.83 before climbing to a peak of $10,348.27 on the 12th; by March 2nd, it had dropped to a price of $8717.72, down 6.99% from the start of February.
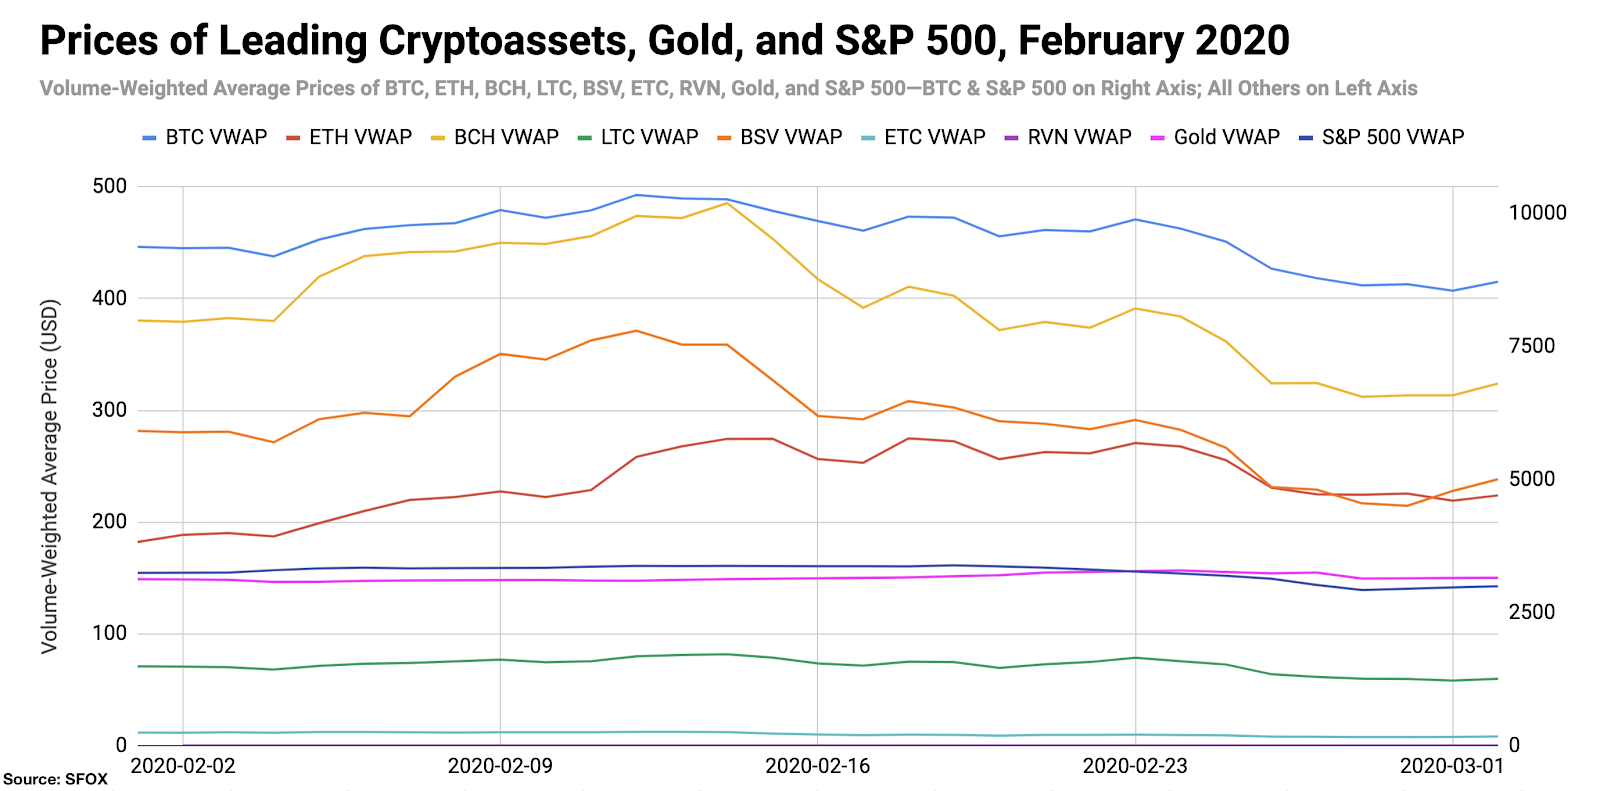
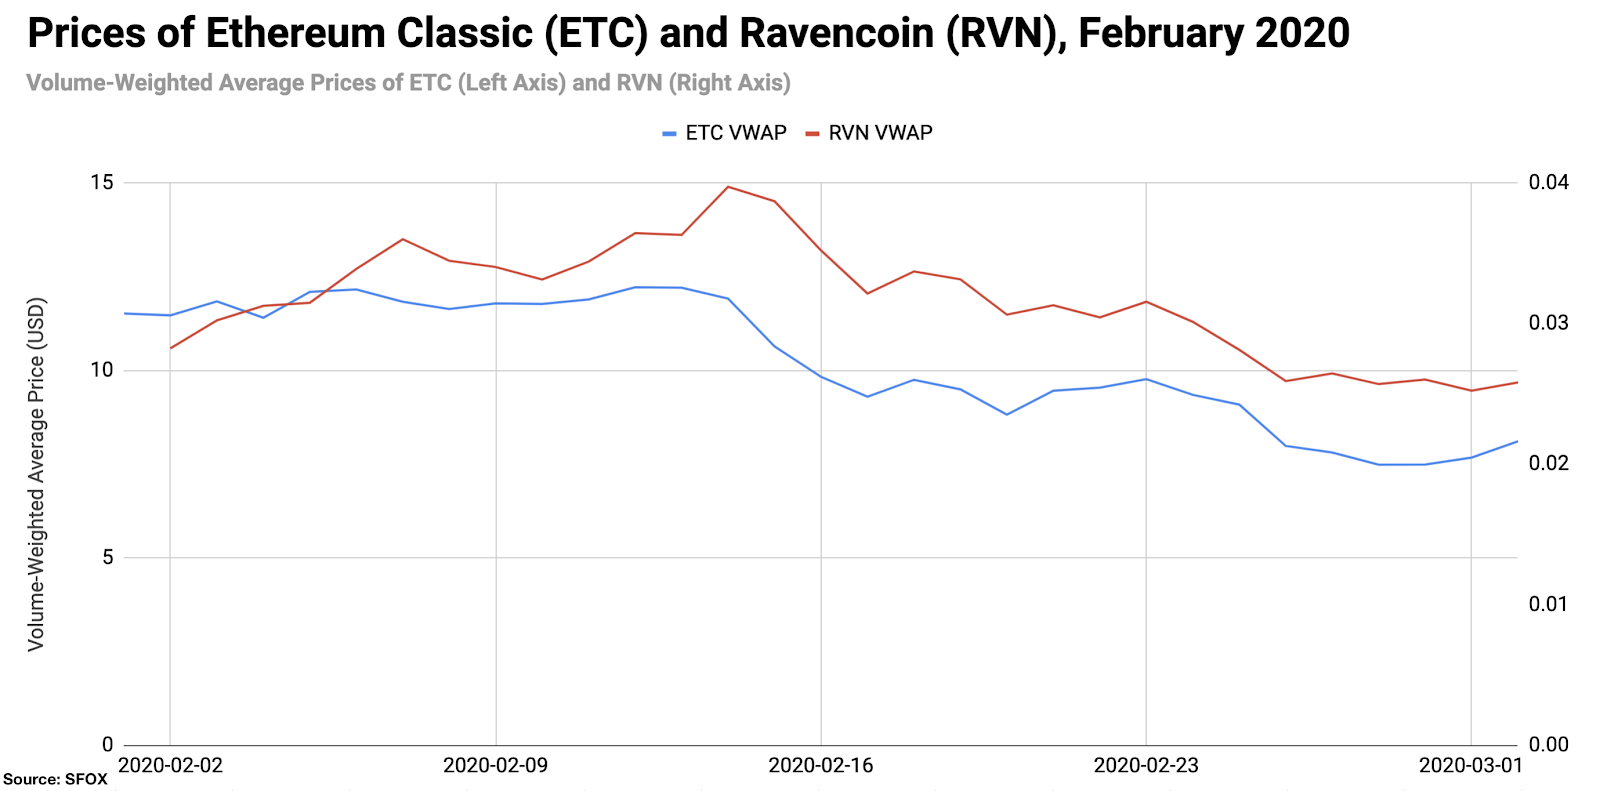
For better visibility of ETC and RVN price movements, please consult the following graph:
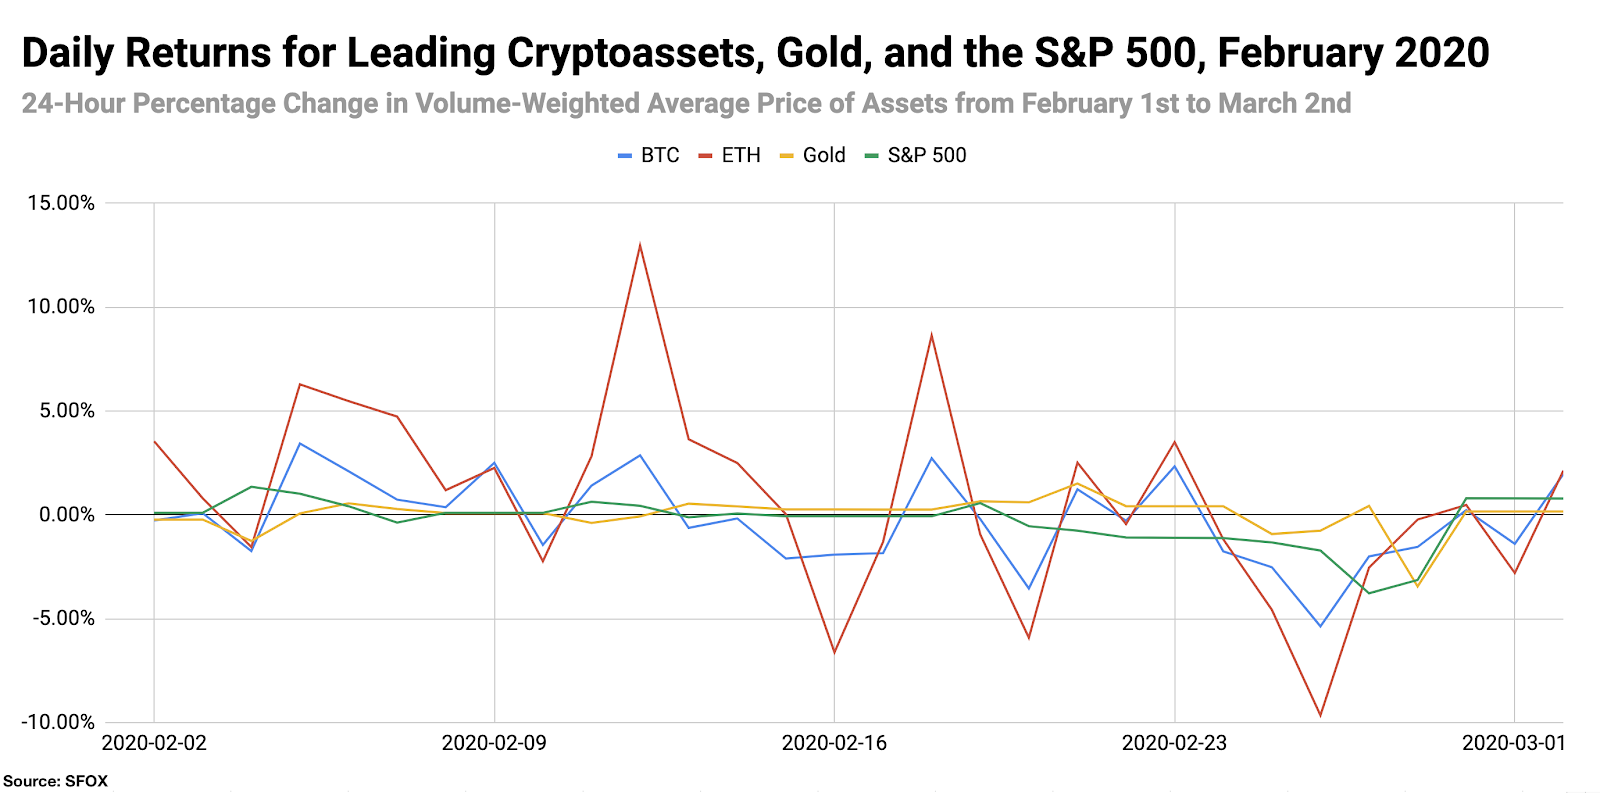
ETH showed the largest single-day returns, increasing 12.97% on February 12th; BSV showed the largest single-day loss, decreasing 13.19% on February 26th.
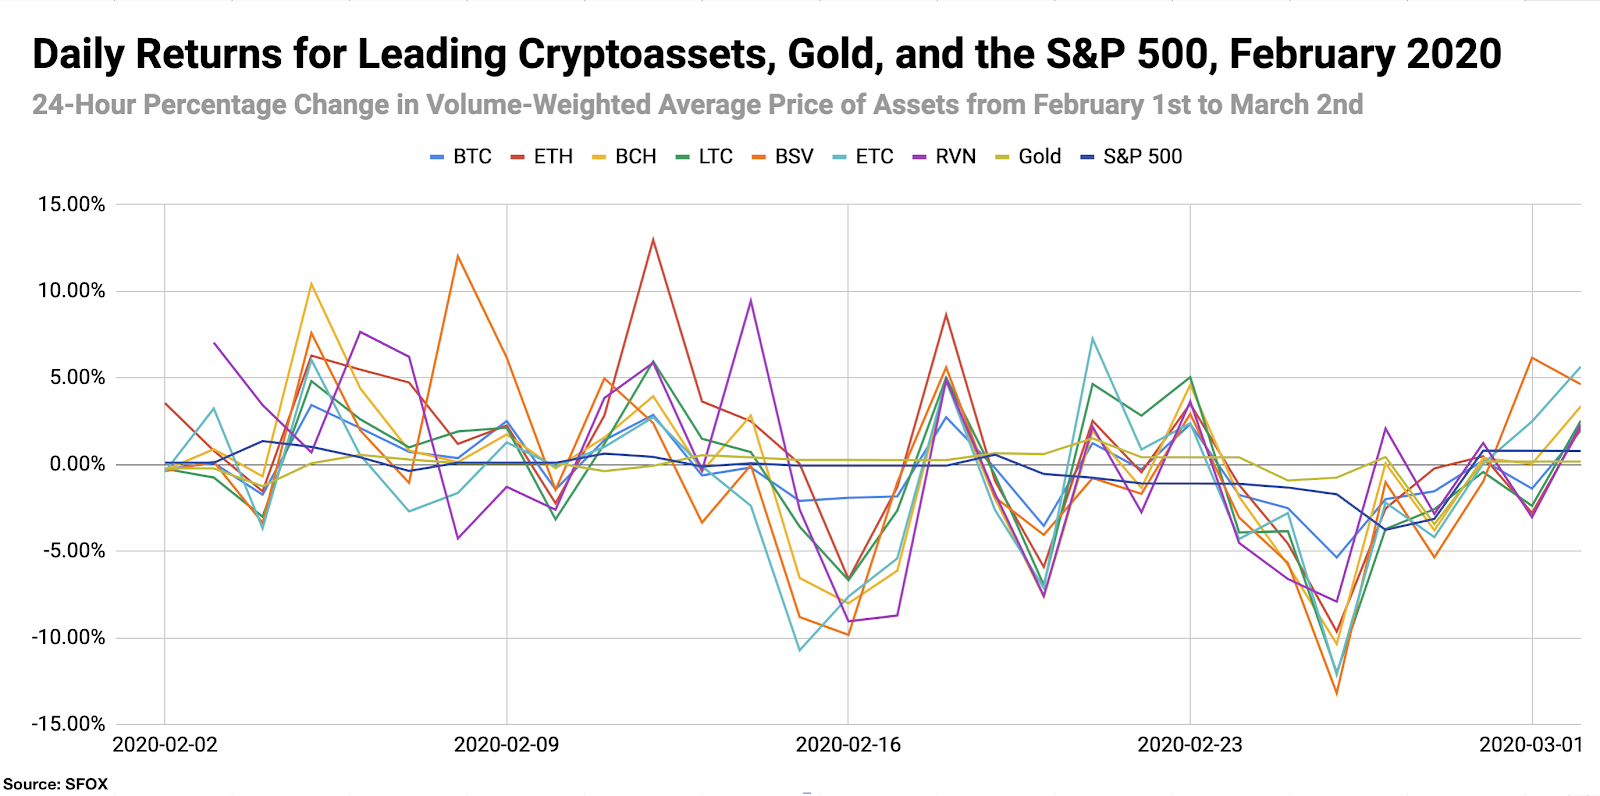
For greater graphical clarity, see this additional chart tracking only the daily returns of BTC, ETH, gold, and the S&P 500:
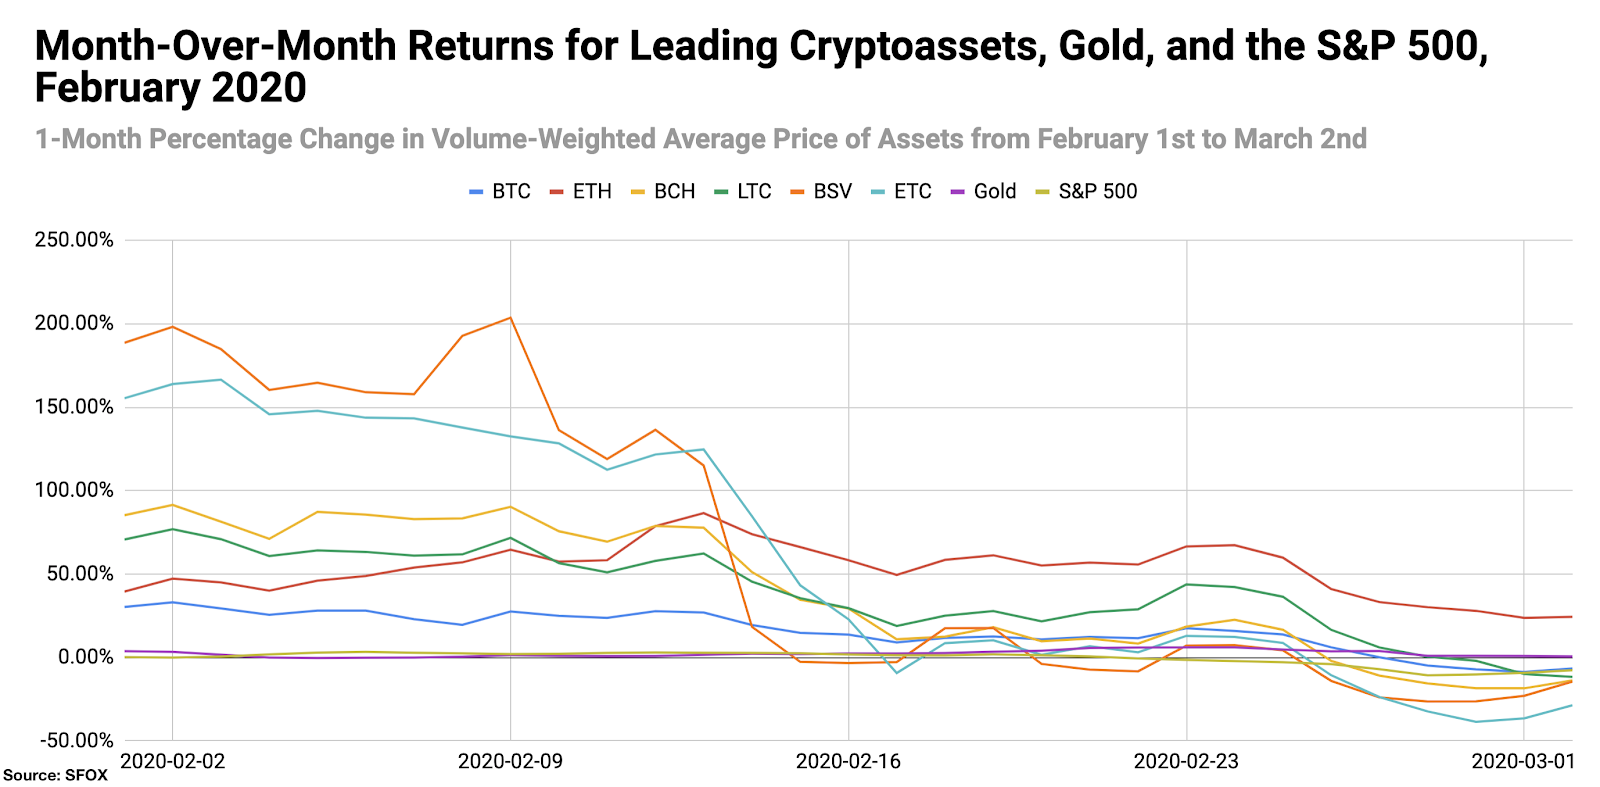
All leading crypto assets showed month-over-month losses as of March 2nd except for ETH, which showed gains of 22.91%. ETC showed the steepest losses at 29.66%; the S&P 500 showed 7.73% losses, while gold showed gains of 0.82%.
Volatility: A Narrower Range of High Volatility
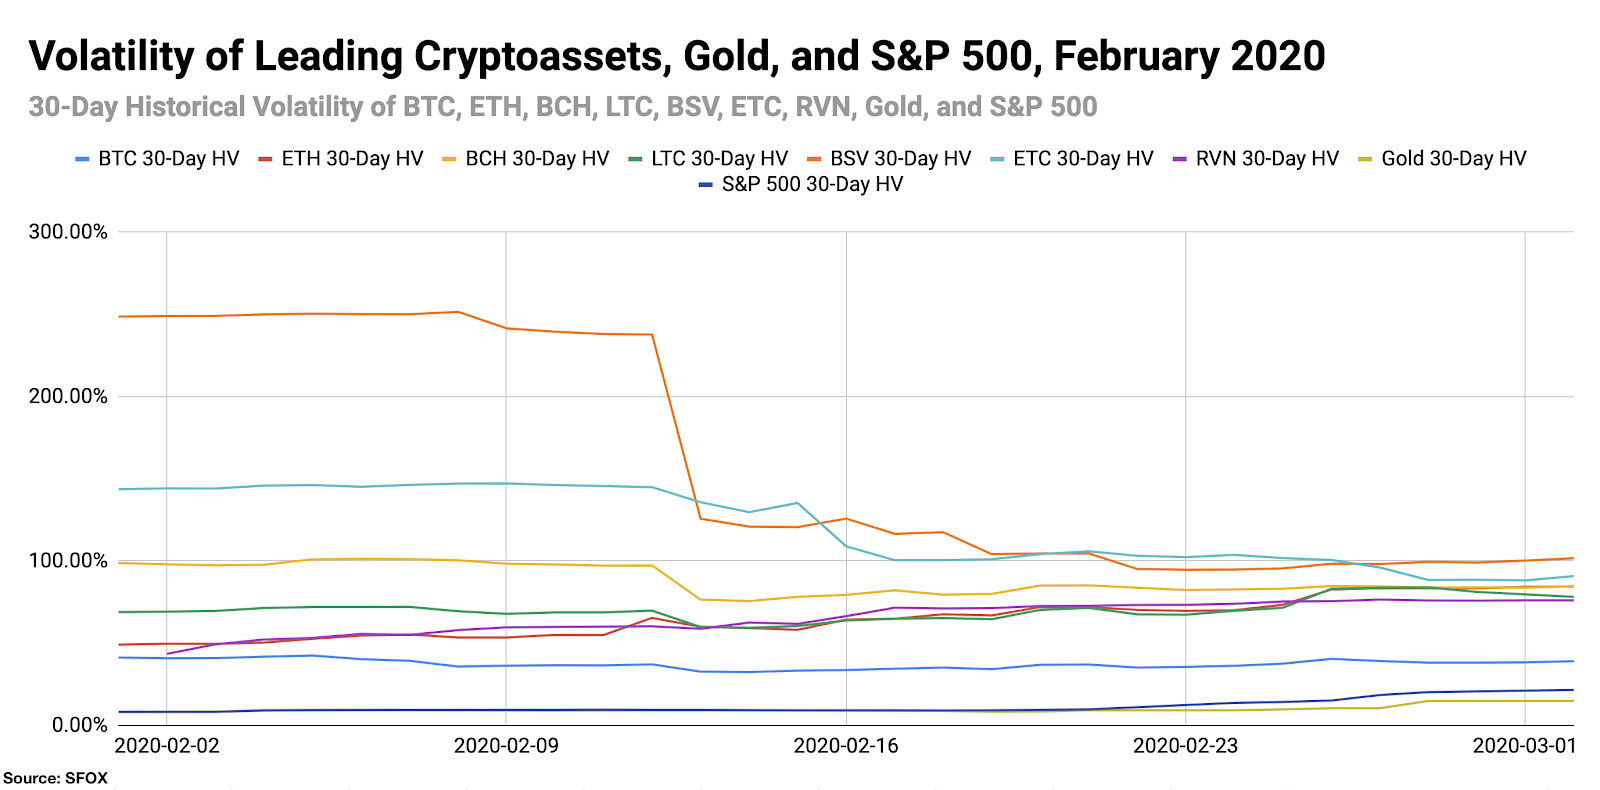
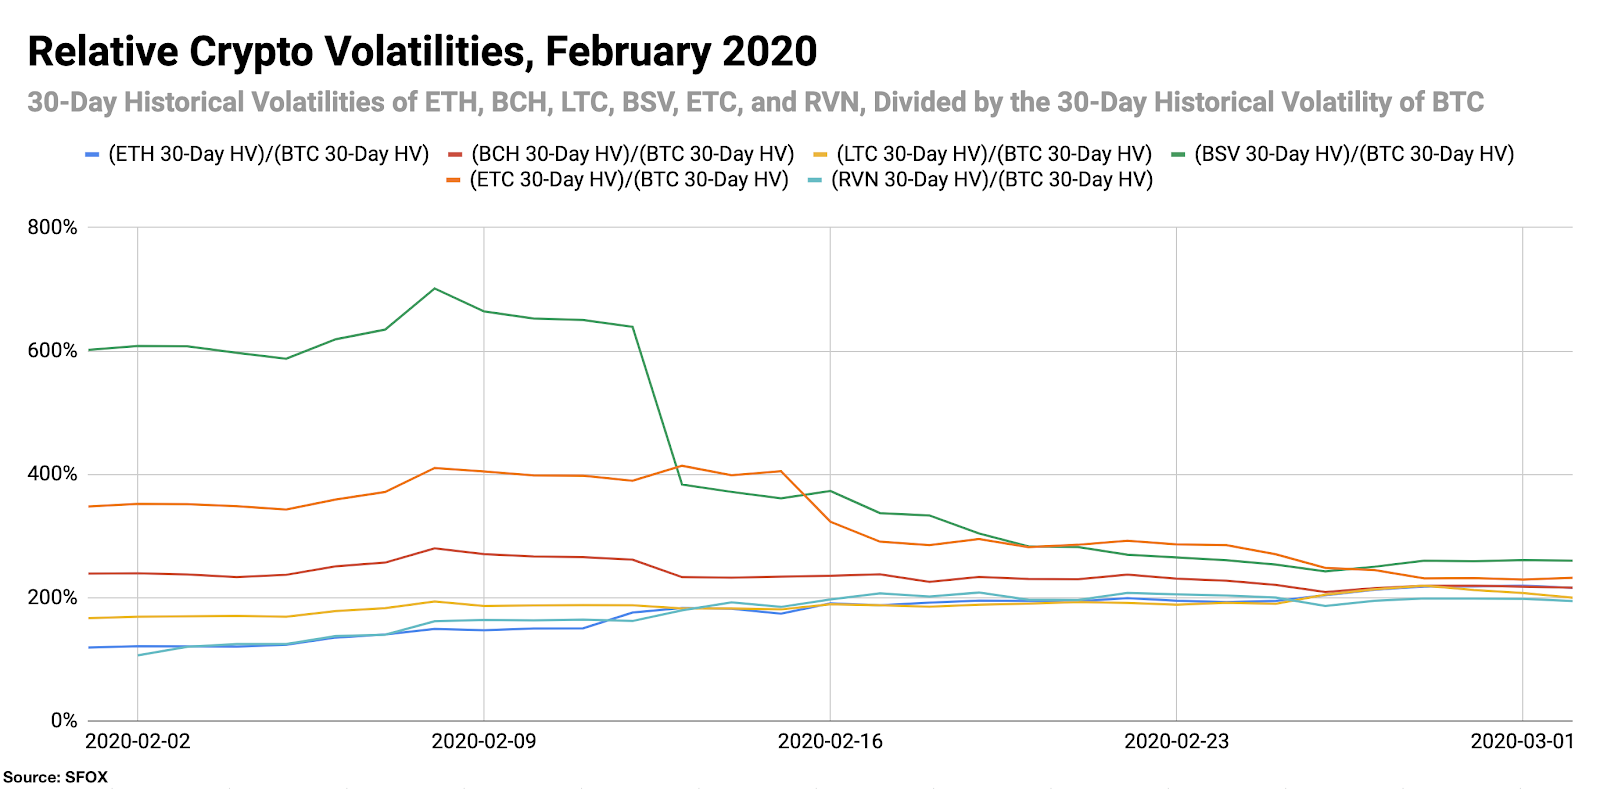
By looking at the 30-day historical volatilities of BTC, ETH, BCH, LTC, BSV, ETC, and RVN, we see that altcoin (i.e. crypto assets other than BTC) volatility became much more uniform (albeit uniformly high) near the end of the month. On February 1st, altcoin volatility ranged from 49.25% (ETH) to 248.68% (BSV); on March 2nd, altcoin volatility ranged from 76.17% (RVN) to 101.80% (BSV). BTC’s historical volatility remained relatively consistent at around 40%, while the volatility of the S&P 500 increased from 8.34% to 21.65% and the volatility of gold increased from 8.16% to 15.00%.
By looking at the 30-day historical volatilities of ETH, BCH, LTC, BSV, ETC, and RVN as a percentage of BTC’s 30-day historical volatility, we can see that ETH and RVN’s volatilities increased relative to BTC over the course of the month, whereas BSV and ETC’s volatilities decreased relative to BTC’s.
Price Correlations: Close Relationships with BTC
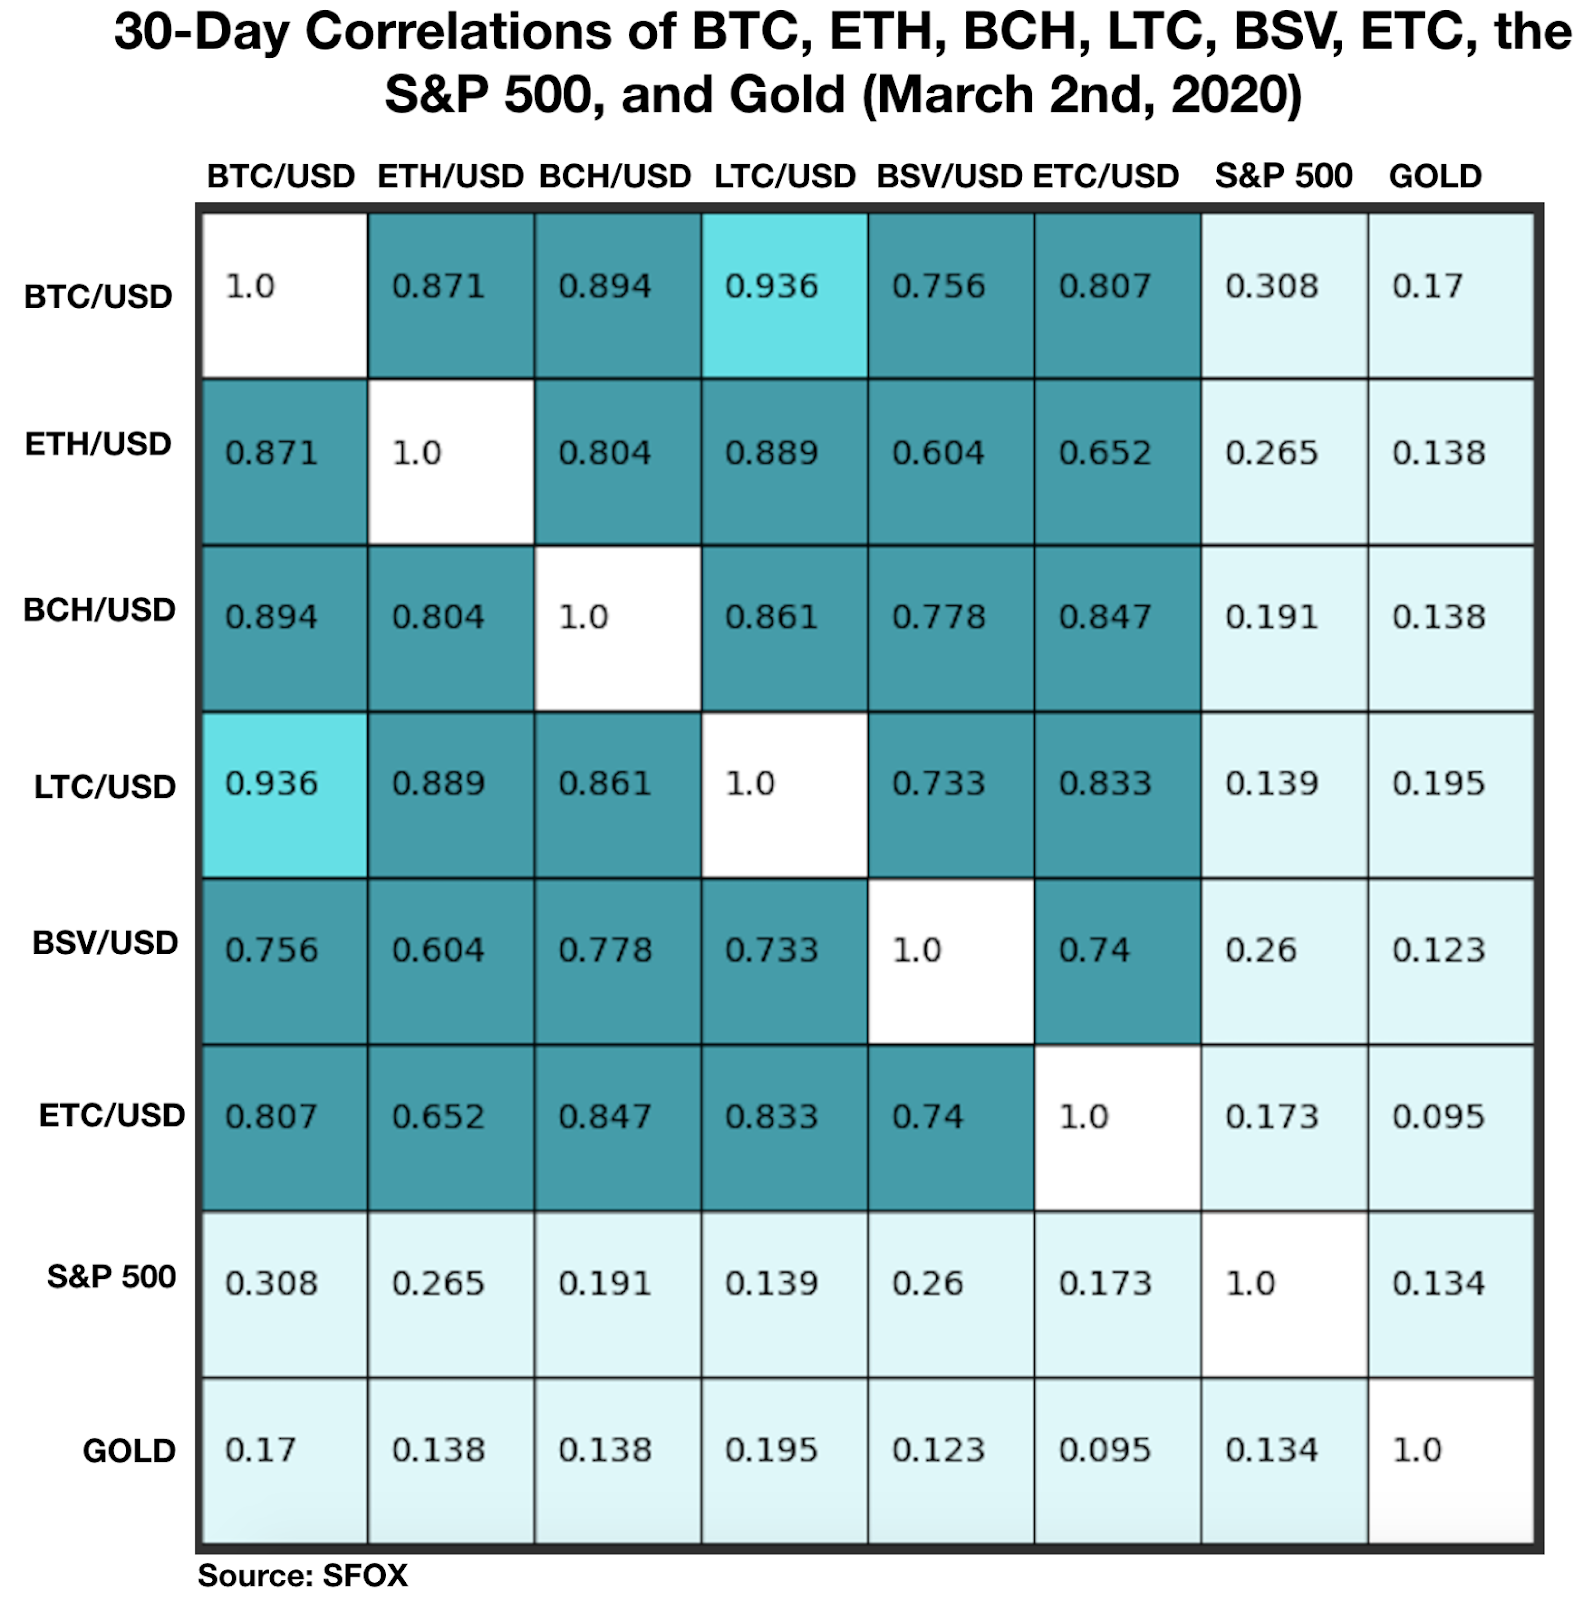
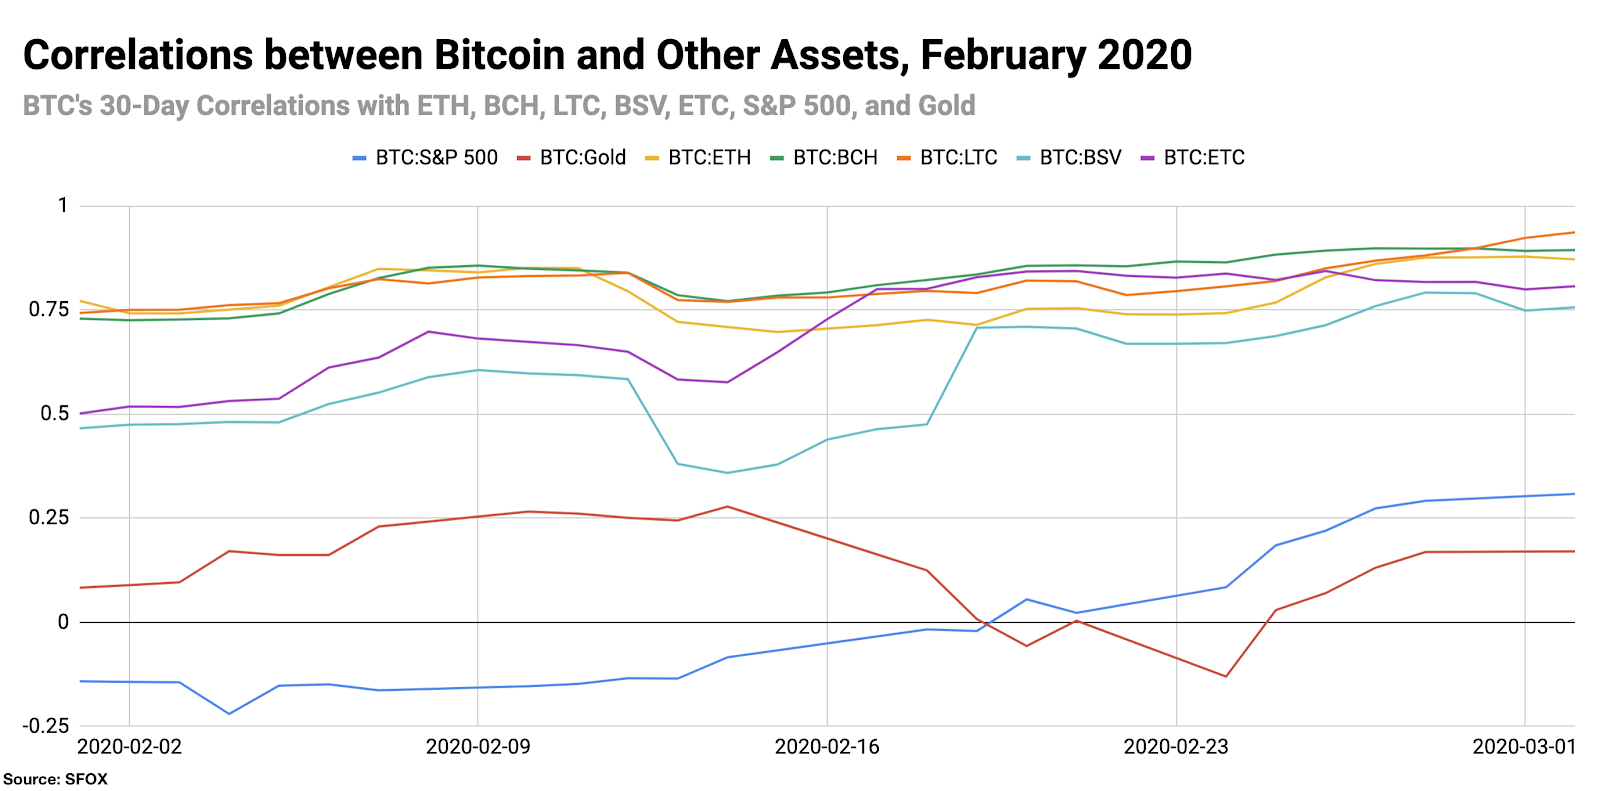
The most recent crypto correlations data show that BTC is seeing high correlations with all other tracked crypto assets — including ETC and BSV, which had previously seen lower (~0.50) correlations with BTC All crypto assets remain largely uncorrelated with gold and the S&P 500.
See the full SFOX crypto correlations matrix below:
For a more complete look at BTC’s correlations with other assets throughout the past month, see the following graph:
About SFOX: Since 2014, SFOX has been providing institutions, pro traders, and anyone serious about trading crypto with the most advanced investment platform available anywhere. Capture the best prices on BTC, ETH, LTC, BCH, BSV, ETC, and RVN anywhere in the crypto market from a single trading account with smart-routing order types you won’t find anywhere else. Sign up now and see why SFOX has facilitated over $11 billion in trading volume to date.
Appendix: Data Sources, Definitions, and Methodology
All cryptocurrency prices are denominated in USD unless otherwise noted.
Note that data collection for RVN began on February 2nd of this year, which is why RVN is not featured in all data analyses. RVN is also denominated in USD for ease of analysis and comparison with other crypto assets, though most RVN trading currently happens in the RVN/BTC pair.
We use two different in-house volatility indices in creating these reports:
1. 30-day historical volatility (HV) indices are calculated from daily snapshots over the relevant 30-day period using the formula:
30-Day HV Index = σ(Ln(P1/P0), Ln(P2/P1), …, Ln(P30/P29)) * √(365)
2. Daily historical volatility (HV) indices are calculated from 1440 snapshots over the relevant 24-hour period using the formula:
Daily HV Index = σ(Ln(P1/P0), Ln(P2/P1), …, Ln(P1440/P1439))* √(1440)
S&P 500 performance data are collected from Yahoo! Finance using GSPC (S&P 500 Index) data. Gold performance data are collected from Yahoo! Finance using GLD (SPDR Gold Trust) data.
30-day asset correlations are calculated using the Pearson method, in accordance with the following formula:

In our calculations, x = 30-day returns for BTC/USD, y = 30-day returns for the other asset in consideration, and r = the correlation coefficient between BTC and the other asset in consideration.
The crypto asset data sources aggregated for crypto prices, correlations, and volatility indices presented and analyzed in this report are the following eight exchanges, the order-book data of which we collect and store in real time:
- bitFlyer
- Binance
- Bitstamp
- Bittrex
- Coinbase
- Gemini
- itBit
- Kraken
Our indices’ integration of data from multiple top liquidity providers offers a more holistic view of the crypto market’s minute-to-minute movement. There are two problems with looking to any single liquidity provider for marketwide data:
- Different liquidity providers experience widely varying trade volumes. For example: according to CoinMarketCap, Binance saw over $20 billion USD in trading volume in November 2018, whereas Bitstamp saw $2 billion USD in trading volume in that same time — an order-of-magnitude difference. Therefore, treating any single liquidity provider’s data as representative of the overall market is myopic.
- Liquidity providers routinely experience interruptions in data collection. For instance, virtually every exchange undergoes regularly scheduled maintenance at one point or another, at which point their order books are unavailable and they therefore have no market data to collect or report. At best, this can prevent analysts from getting a full picture of market performance; at worst, it can make it virtually impossible to build metrics such as historical volatility indices.
Building volatility indices that collect real-time data from many distinct liquidity providers mitigates both of these problems: collecting and averaging data from different sources prevents any single source from having an outsized impact on our view of the market, and it also allows us to still have data for analysis even if one or two of those sources experience interruptions. We use five redundant data collection mechanisms for each exchange in order to ensure that our data collection will remain uninterrupted even in the event of multiple failures.
The above references an opinion and is for informational purposes only. It is not intended as and does not constitute investment advice, and is not an offer to buy or sell or a solicitation of an offer to buy or sell any cryptocurrency, security, product, service or investment. Seek a duly licensed professional for investment advice. The information provided here or in any communication containing a link to this site is not intended for distribution to, or use by, any person or entity in any jurisdiction or country where such distribution or use would be contrary to law or regulation or which would subject SFOX, Inc. or its affiliates to any registration requirement within such jurisdiction or country. Neither the information, nor any opinion contained in this site constitutes a solicitation or offer by SFOX, Inc. or its affiliates to buy or sell any cryptocurrencies, securities, futures, options or other financial instruments or provide any investment advice or service.
