Summary:
- The SFOX Multi-Factor Market Index has moved from mildly bullish to neutral as of August 5th, 2019.
- The S&P 500 is currently negatively correlated with all leading cryptocurrencies.
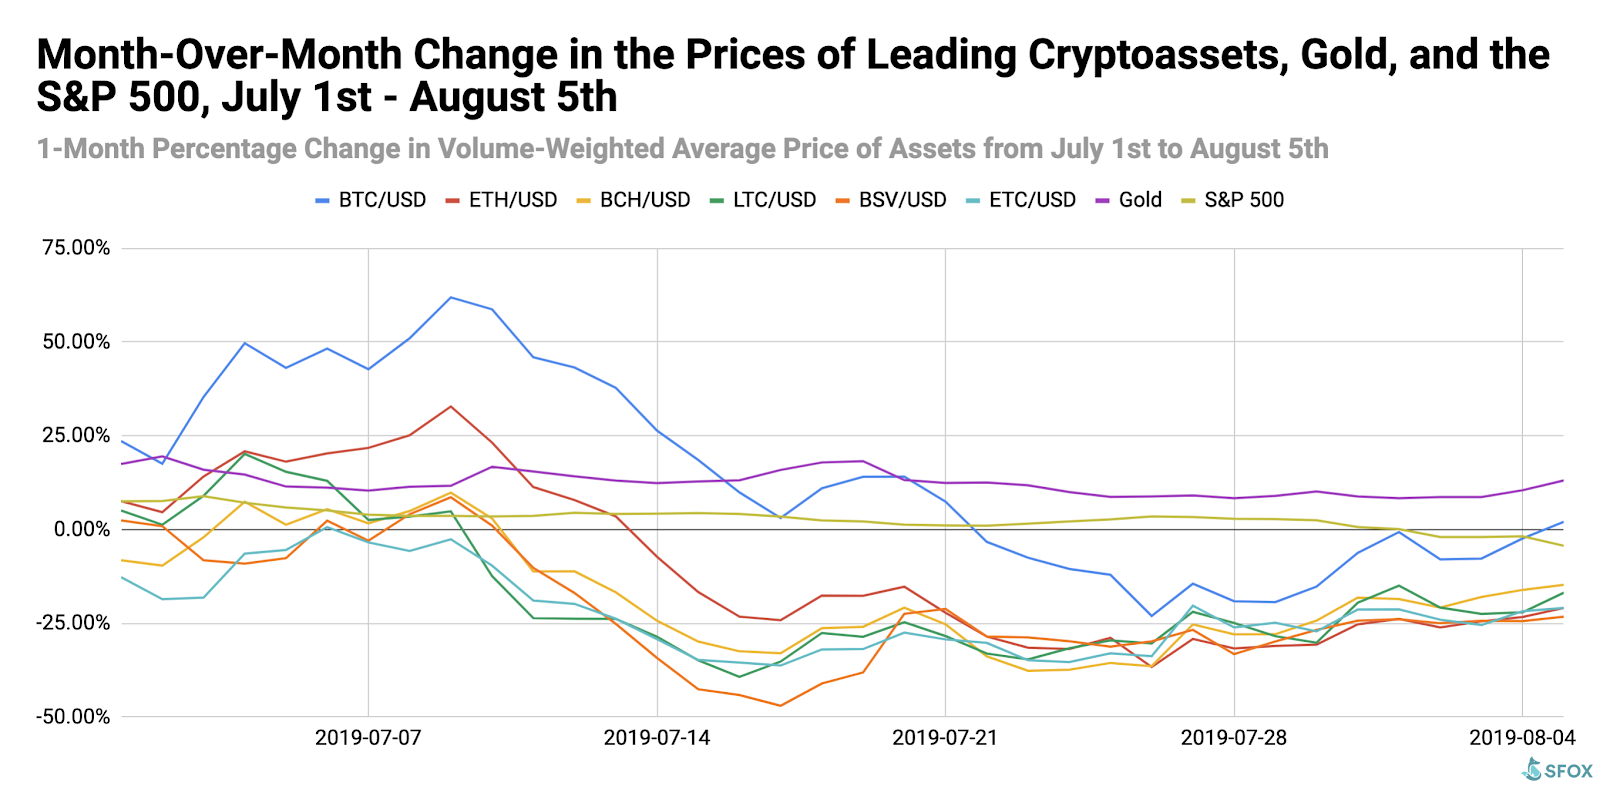
- Bitcoin was the only major cryptoasset with positive month-over-month returns as of August 5th, 2019.
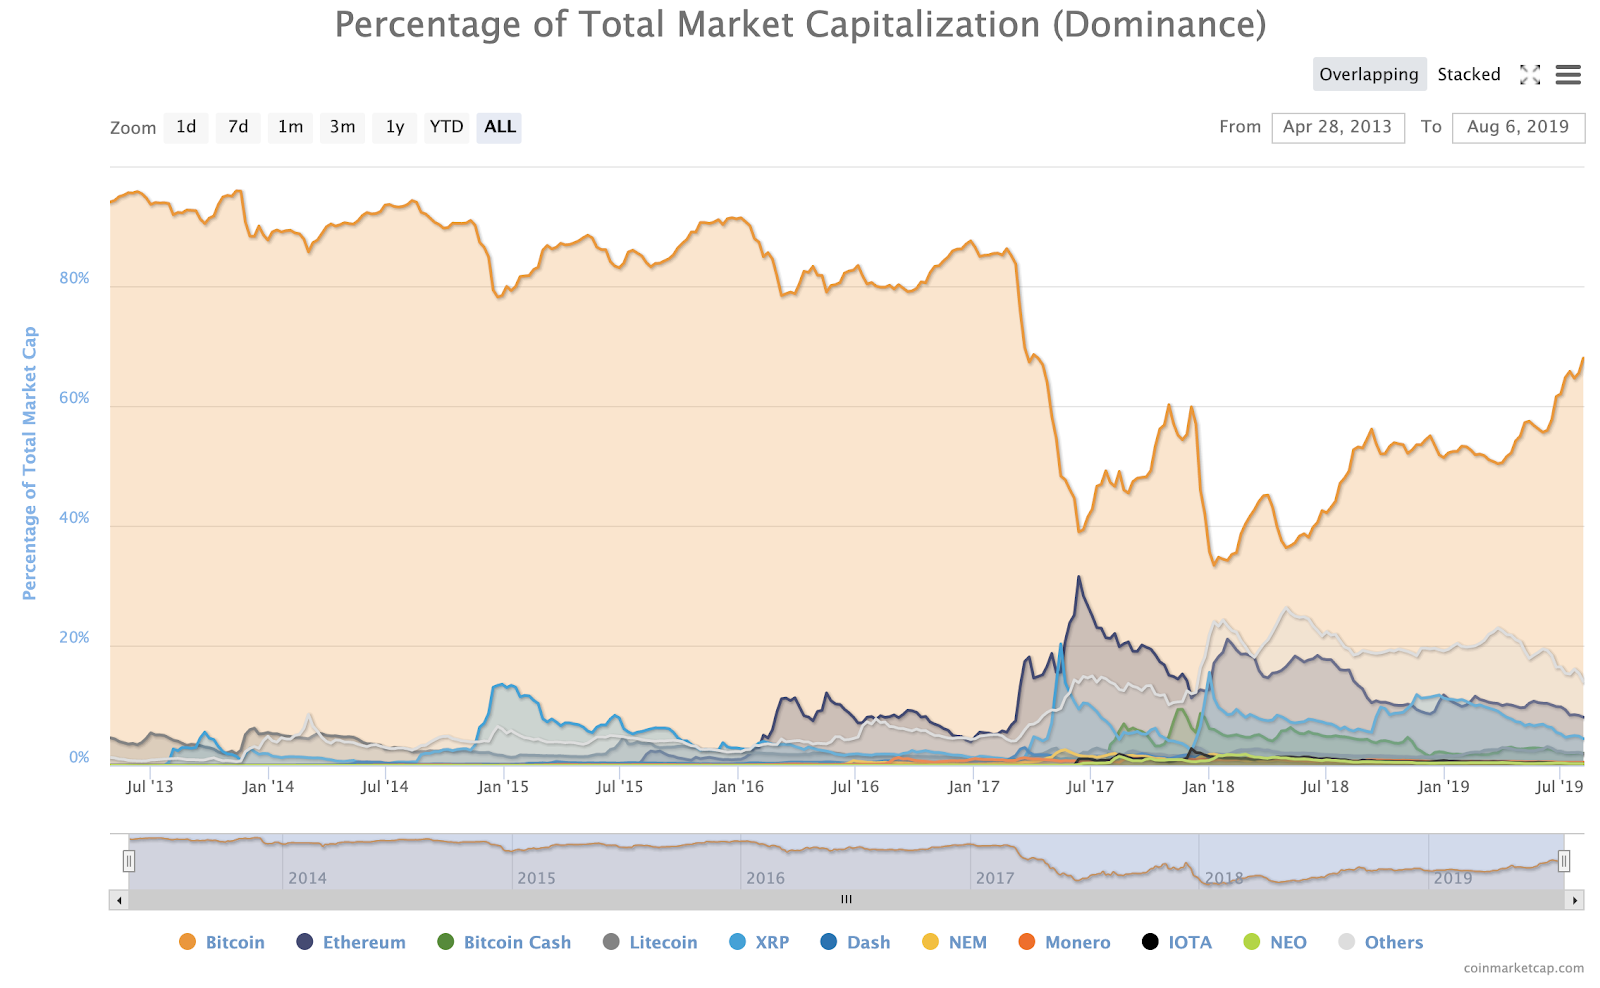
- Bitcoin dominance is currently at its highest level since April 2017.
- As the U.S.-China trade war persists and more regulatory clarity is being achieved around Bitcoin, BTC appears to be emerging more and more as a global hedge.
- Watch for further trade war developments and futures expirations to potentially impact crypto volatility in the coming month.
In the July 2019 edition of our monthly volatility report, the SFOX research team has collected price, volume, and volatility data from eight major exchanges and liquidity providers to analyze the global performance of 6 leading cryptoassets — BTC, ETH, BCH, LTC, BSV, and ETC — all of which are available for algorithmic trading on our trading platform.
The following is a report and analysis of their volatility, price correlations, and further development in the last month. (For more information on data sources and methodology, please consult the appendix at the end of the report.)
Current Crypto Market Outlook: Neutral
Based on our calculations and analyses, the SFOX Multi-Factor Market Index, which was set at mildly bullish as of July 9th, 2019, has been moved to neutral as of August 5th, 2019.
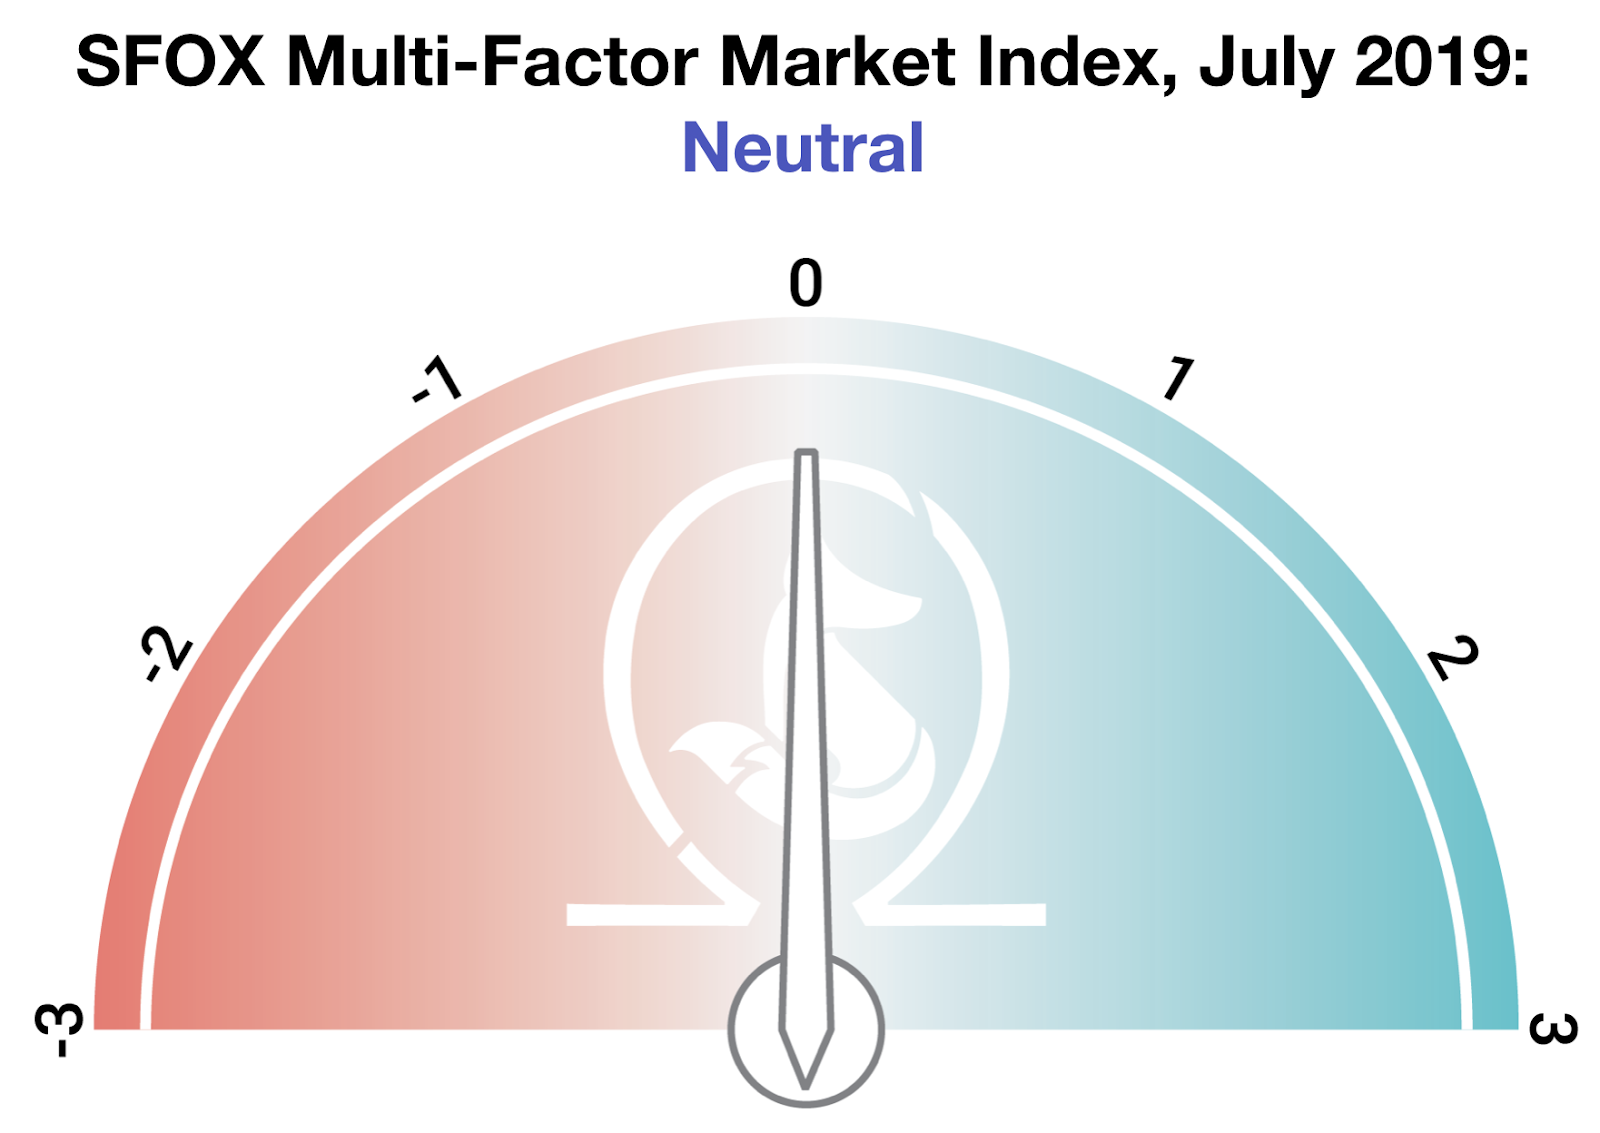
We determine the monthly value of this index by using proprietary, quantifiable indicators to analyze three market factors: price momentum, market sentiment, and continued advancement of the sector. It is calculated using a proprietary formula that combines quantified data on search traffic, blockchain transactions, and moving averages. The index ranges from highly bearish to highly bullish.
It’s possible that we may be seeing broader macroeconomic uncertainty affect the market’s outlook on the crypto sector at this juncture. Data have suggested for months that investors may be using bitcoin as a hedge against global markets; with many uncertain about the impact of rising tariffs and global currency instability on the market, it may be the case that traders are equally unsure of crypto’s future.
Analysis of July 2019 Crypto Performance
As traditional markets and the global economy has faced the challenge of an ongoing U.S.-China trade war, Bitcoin appears to be further maturing as a hedge against global market instability. Perhaps further legitimized in some people’s minds — or at least popularized — by the Senate and Congressional hearings on Facebook’s proposed cryptocurrency, Bitcoin has proven itself in the last few weeks as the dominant cryptocurrency that increasingly appears to wax as traditional markets wane.
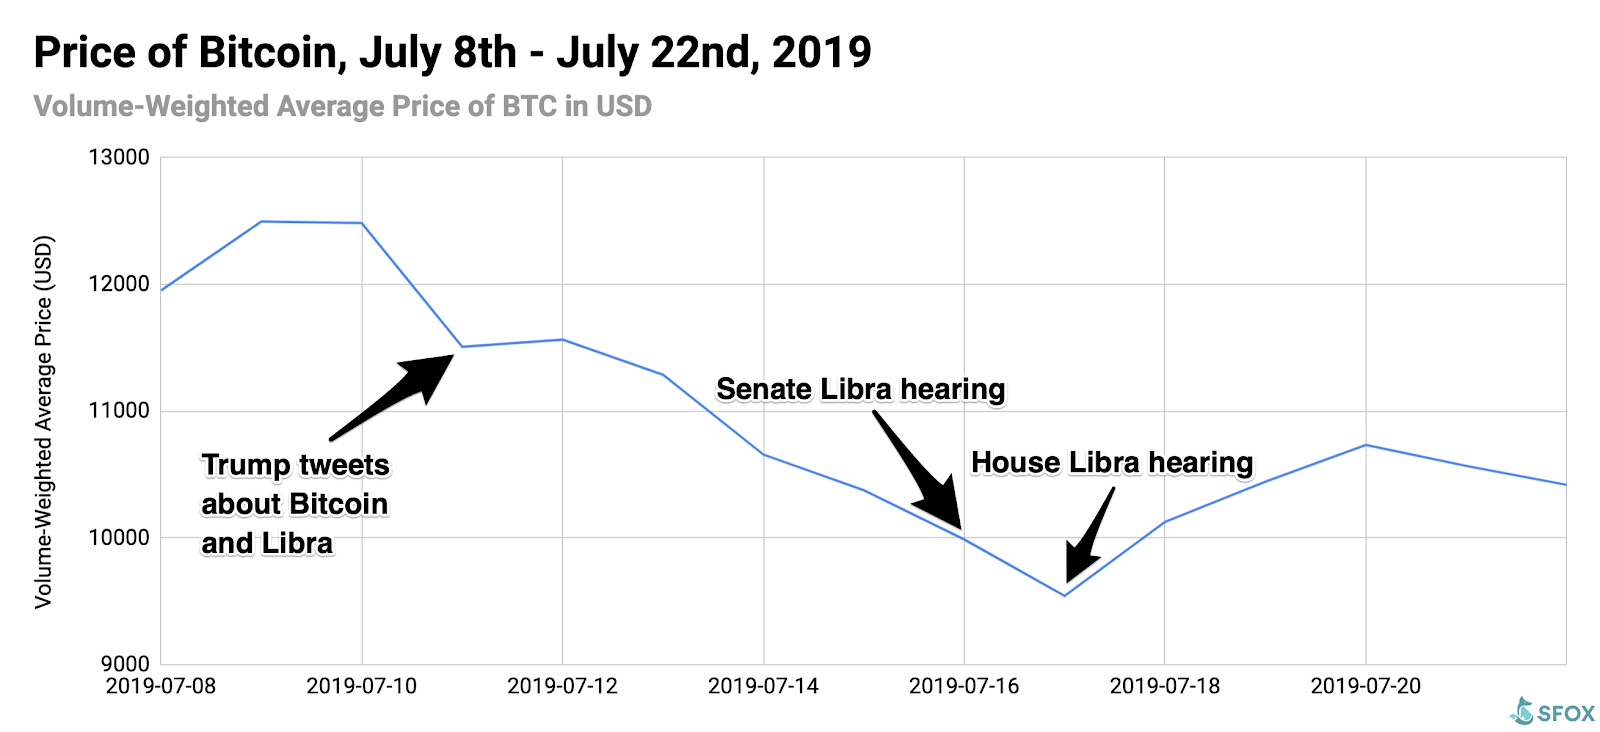
Trump and lawmakers on Capitol Hill scrutinized Facebook’s cryptocurrency initiative, Libra, bringing renewed attention to Bitcoin and the crypto sector at large (July 11th — 17th).
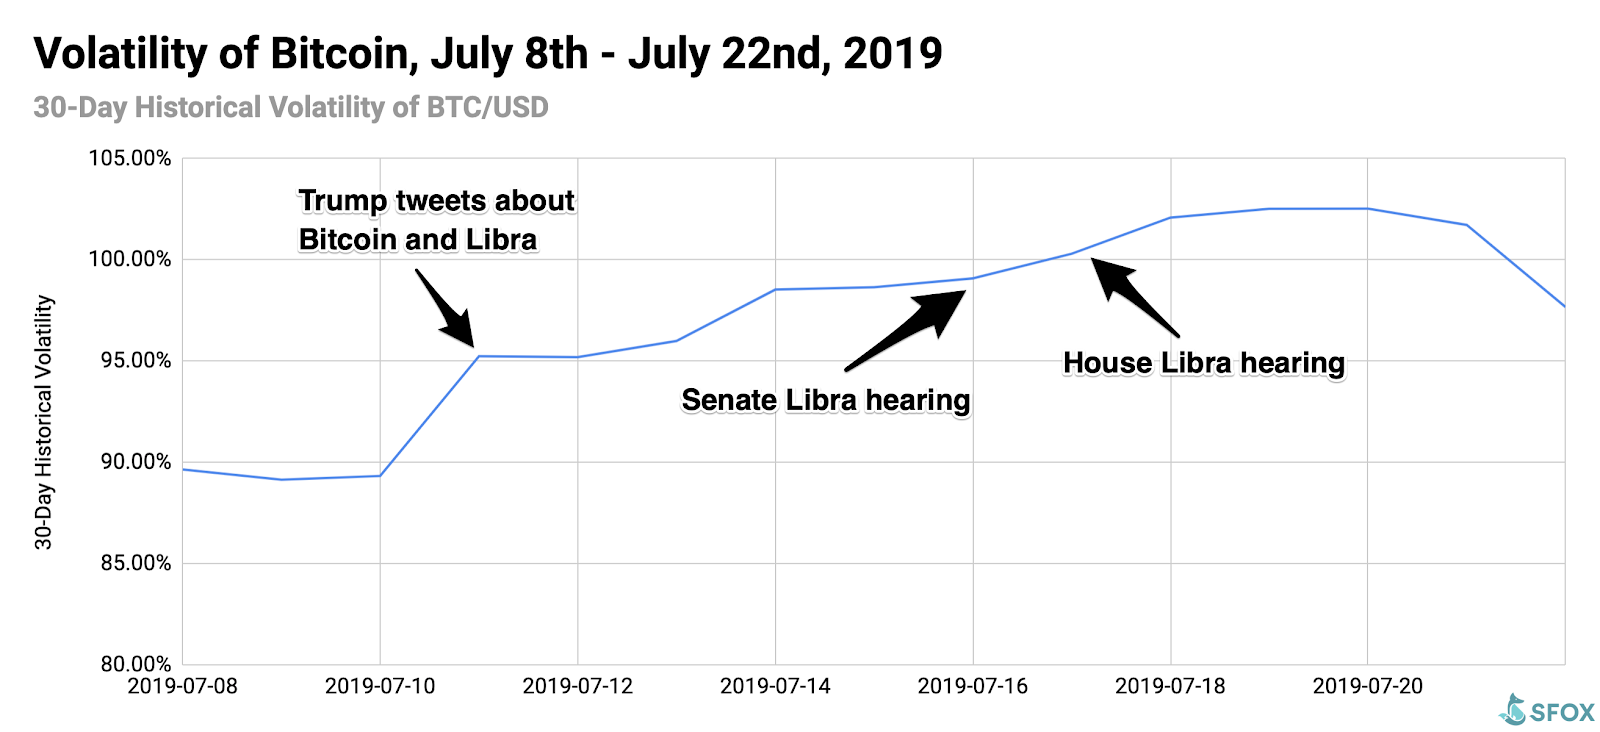
As SFOX detailed in a previous analysis, the week from July 11th to July 17th was dominated by Capitol Hill discussing the merits and dangers of Facebook’s Project Libra, beginning with bearish Presidential Tweets about Libra and Bitcoin on the 11th and ending with Senate and Congressional hearings on the 16th and 17th, As perceived regulatory scrutiny around the crypto sector heightened, the price to buy bitcoin declined from its peak of $12495.91 on July 9th.
Over the same week, the volatility of BTC steadily increased, from 89.33% on July 10th to 100.30% on July 17th. This decrease in price and increase in volatility may reflect market uncertainty as to how governmental scrutiny of a private blockchain project (Facebook’s Project Libra) will end up affecting public blockchains such as Bitcoin.
If you missed the Senate and House’s hearings on Libra, SFOX rounded up the 10 most important takeaways for the crypto market.
The IRS sent more than 10,000 letters warning U.S. taxpayers that they may owe money on crypto taxes (July 26th).
Beginning in late July, the IRS reportedly sent 10,000 letters of varying severity warning certain taxpayers that they may owe taxes on taxable crypto events. This news came two weeks after a leaked slide deck revealed that the IRS is training its agents to uncover crypto wallets. This news reinforced the Facebook hearings’ narrative that the government is increasingly taking cryptocurrency seriously, which lead to further regulatory clarity allowing Bitcoin and crypto to continue maturing as an asset class. (SFOX traders can take advantage of automatically generated transaction reports to succinctly summarize and report their trade activity on the SFOX trading platform.)
The price to buy bitcoin and other cryptoassets increased as the yuan fell to a new ten-year low (August 5th) and a China court ruled that bitcoin constitutes virtual property (July 18th).
As the yuan traded against the dollar at 7 yuan per dollar for the first time in ten years, the price of BTC climbed for than 7%, from $10851.06 to $11645.48. Combined with a Chinese court providing more apparent regulatory acceptance of crypto by ruling that bitcoin constitutes legal property, this seems to suggest that some traders, potentially in both the U.S. and China, may be viewing crypto and Bitcoin as a kind of safe haven during the ongoing U.S.-China trade war.
The S&P 500 is currently negatively correlated with all leading cryptocurrencies.
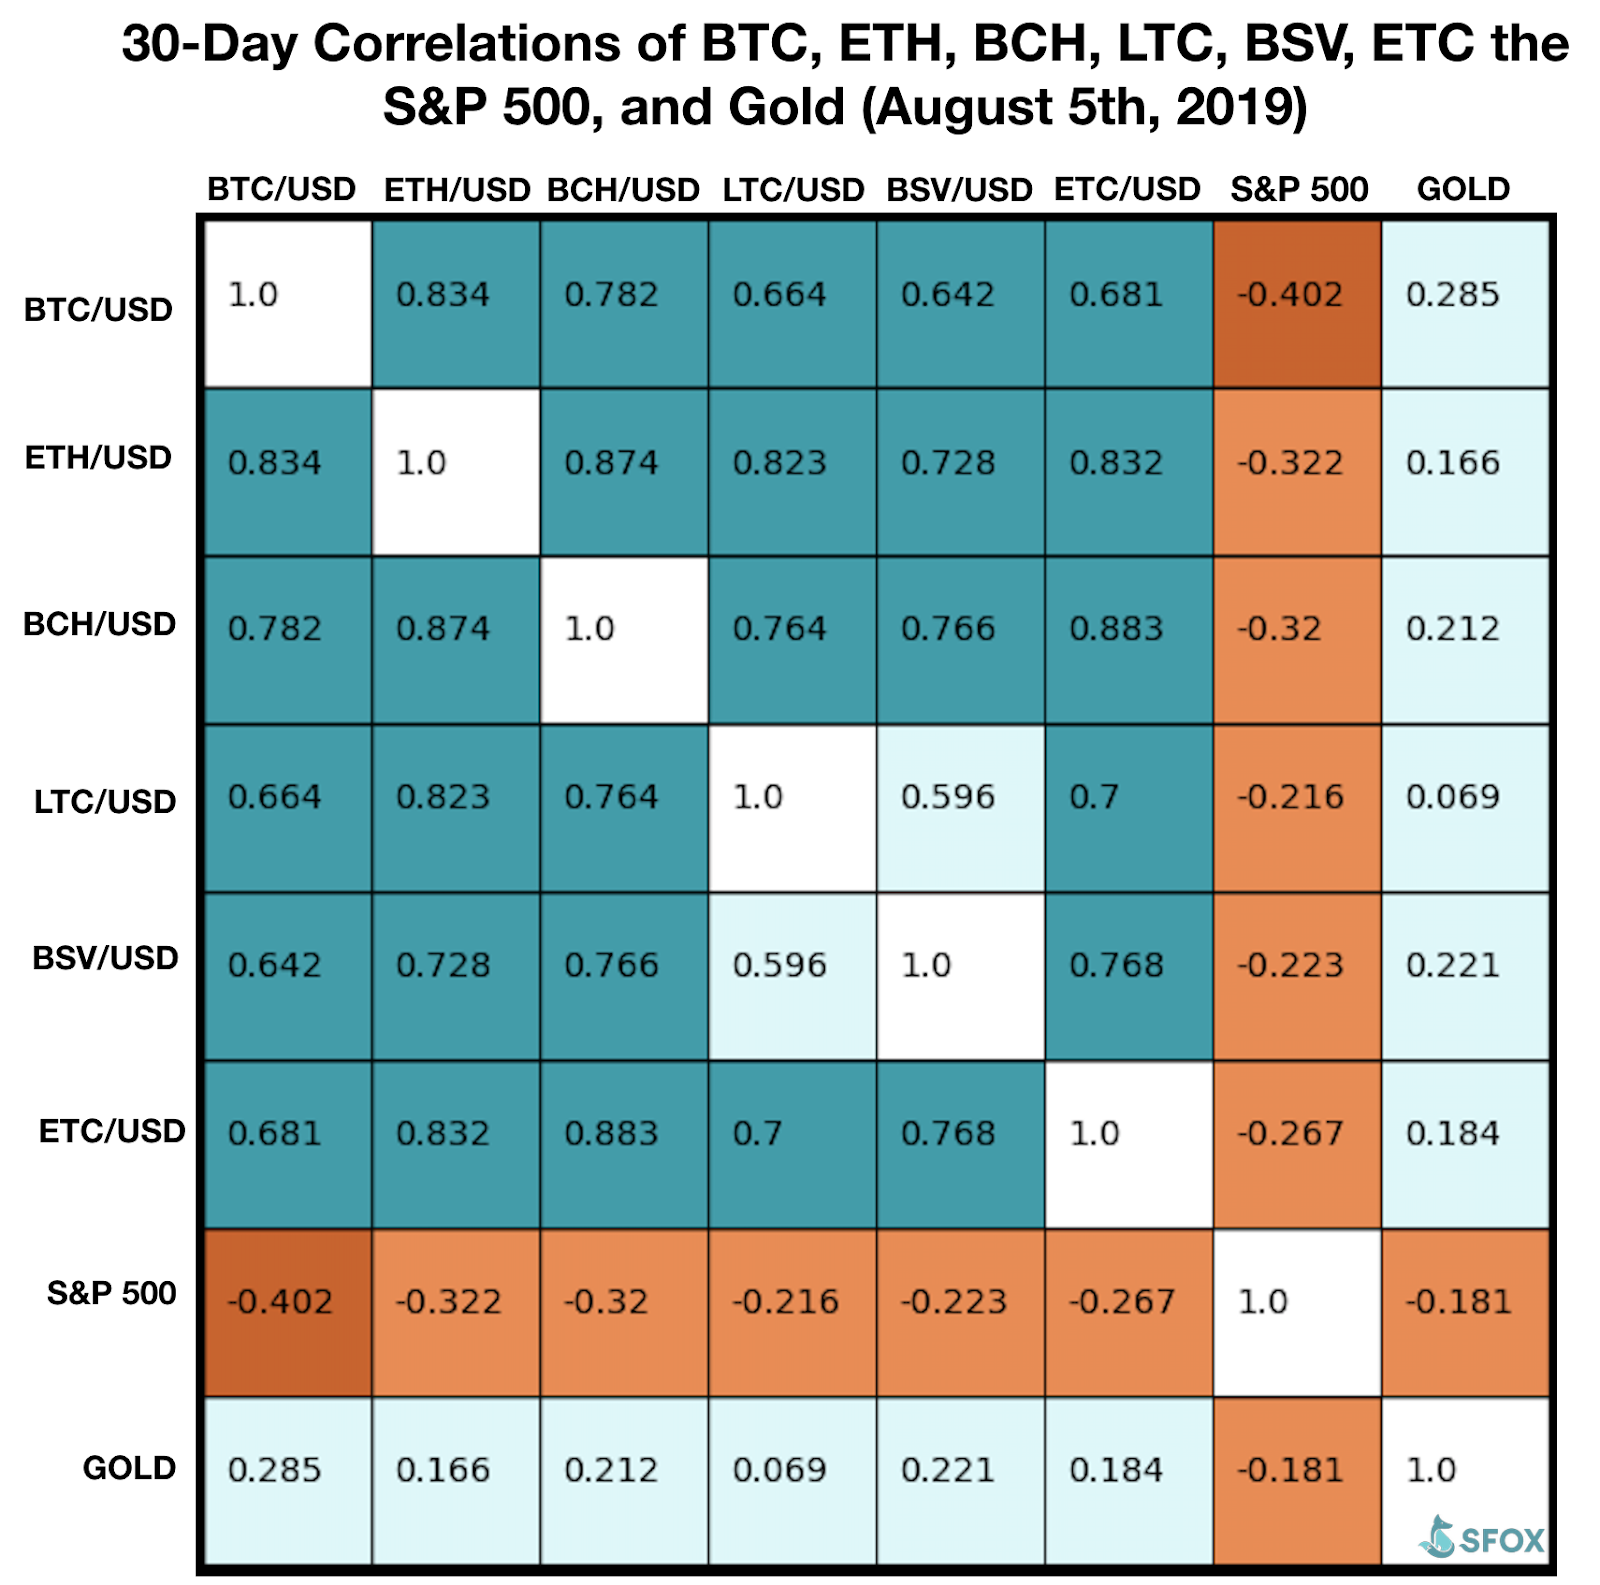
Similar to the figures SFOX reported in May 2019, BTC, ETH, BCH, LTC, BSV, and ETC all showed negative correlations with the S&P 500 this past month. Negative correlations with the S&P 500 ranged from BTC, at a correlation of -0.402, to LTC, at a correlation of -0.216.
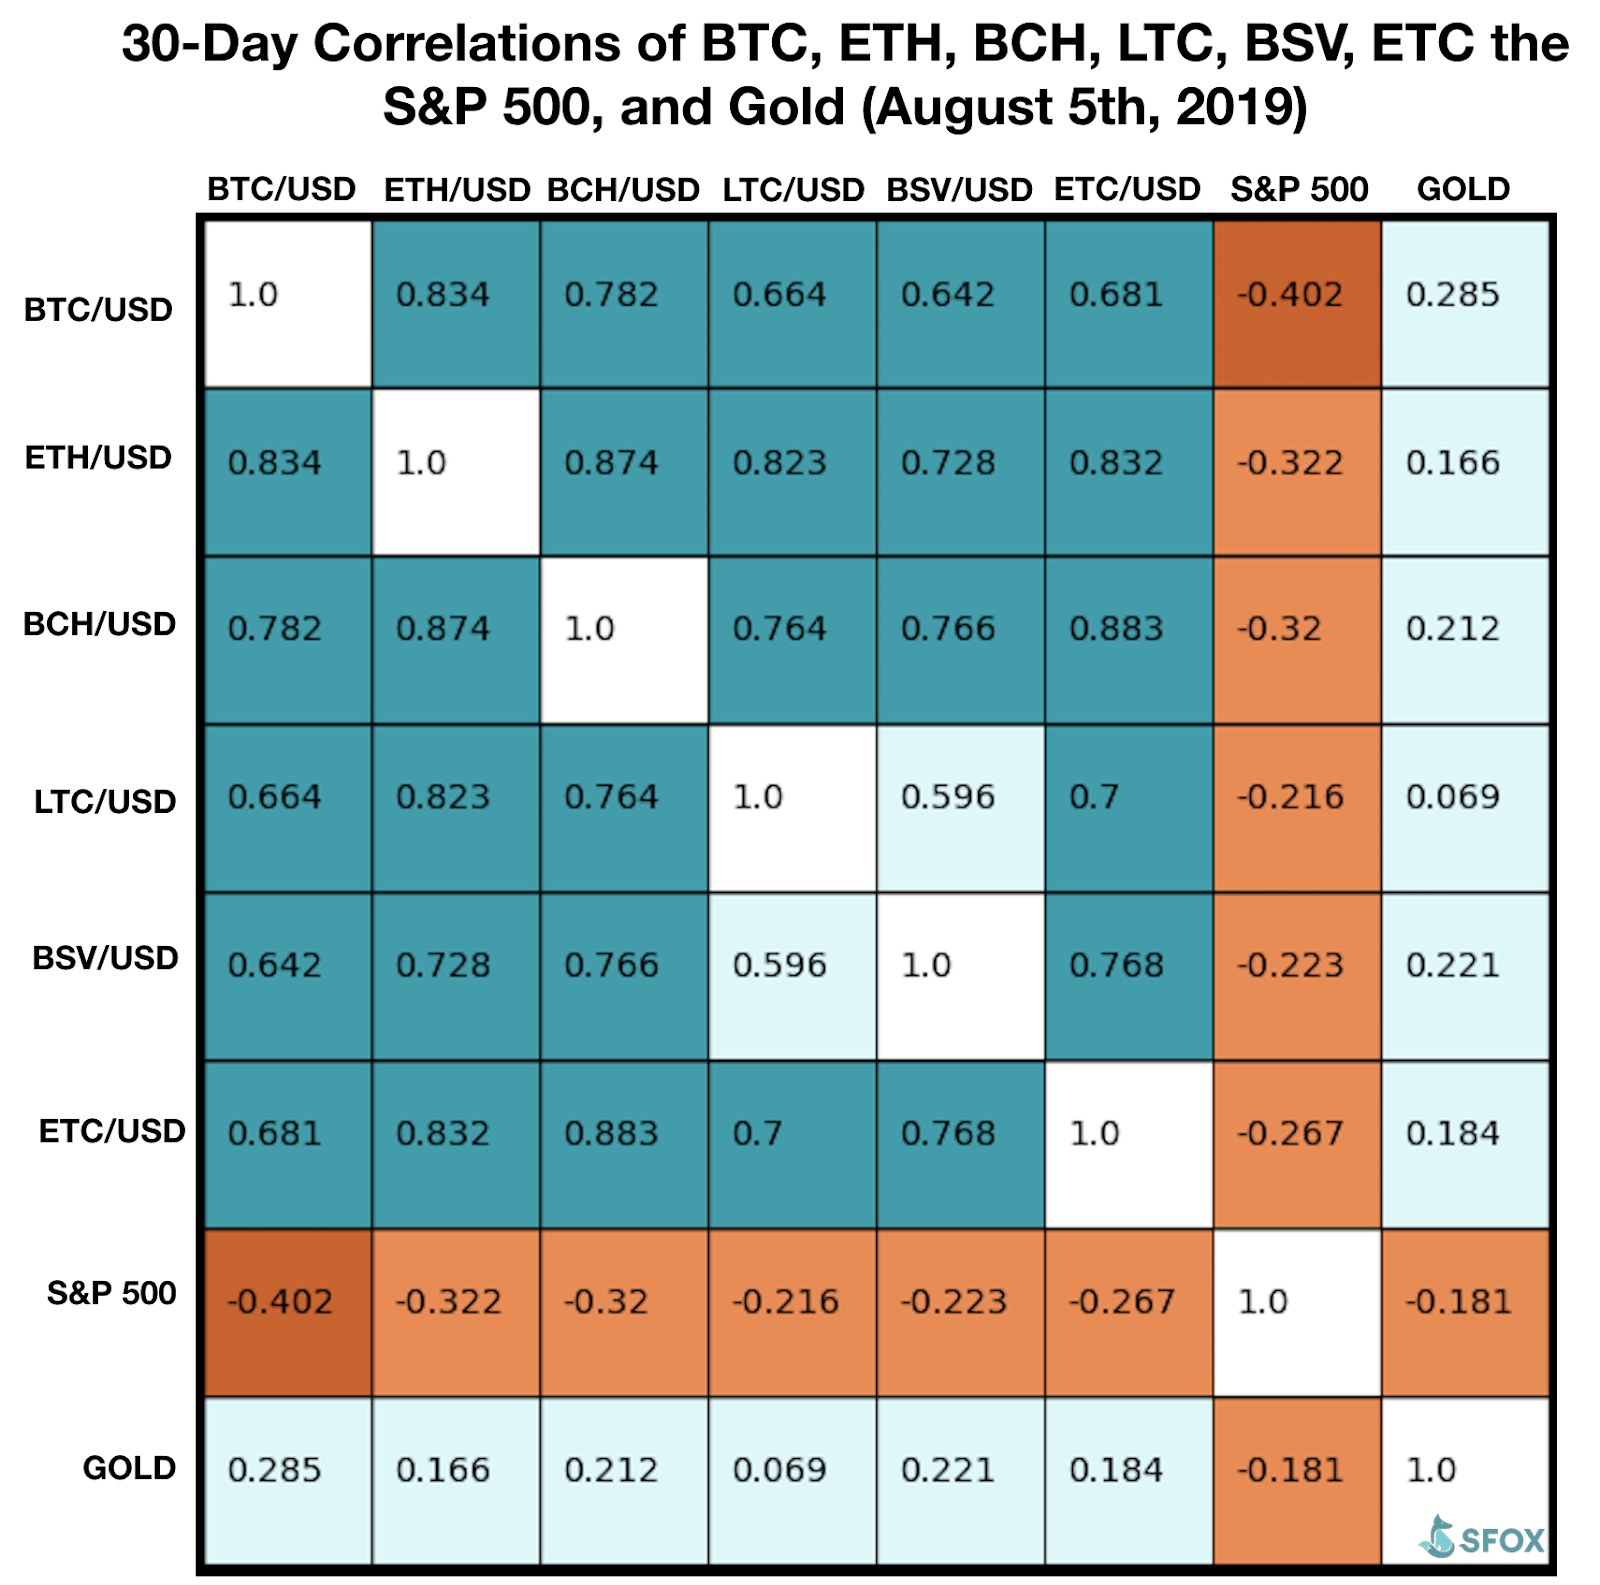
Notably, all of these cryptoassets were more negatively correlated with the S&P 500 than gold was (the gold:S&P 500 correlation was -0.181). In light of this, a case could be made that traders may increasingly be viewing cryptocurrencies, especially bitcoin, as a hedge against global markets — perhaps even more so than gold.(this is a stretch imo. “A case can be made”
Bitcoin was the only major cryptoasset with positive month-over-month returns as of August 5th, 2019.
While other cryptocurrencies have stumbled and yielded month-over-month losses since last month’s crypto rally, BTC, as of this past Monday, has shown positive month-over month returns.
Combined with the continued upward trend of BTC market dominance that SFOX first reported last month, this may suggest that the market is coalescing around Bitcoin as a store of value in tumultuous global economic conditions: even as coins like ether are starting to step out of Bitcoin’s shadow, mainstream traders and investors may still think of “Bitcoin” as synonymous with crypto and therefore be looking to it first as an alternative hedging asset.
What to Watch in the Rest of August 2019
Look to these events as potentially moving the volatility indices of BTC, ETH, BCH, LTC, BSV, and ETC in the remainder of August 2019:
Further trade war developments between the U.S. and China.
As bitcoin and the broader crypto market appear to remain reactive to the trade conflict between the U.S. and China, those watching the crypto market might also consider keeping an eye on equities markets and foreign relations news.
CME BTC futures last-trade date (August 30th).
Crypto volatility typically moves around the time of futures expirations. With CBOE having backed off from BTC futures for the time being, the date of the CME’s futures expirations may potentially impact volatility more than usual.
Get the SFOX edge in volatile times through our proprietary algorithms directly from your SFOX account.
The Details: July 2019 Crypto Price, Volatility, and Correlation Data
Price Performance: Peaks and Troughs
After peaking at a price of $12495.91 on July 9th, the price to buy bitcoin receded back to a low of $9543.13 on July 17th. Since July 28th, the price of bitcoin has increased over 23% to $11645.48.
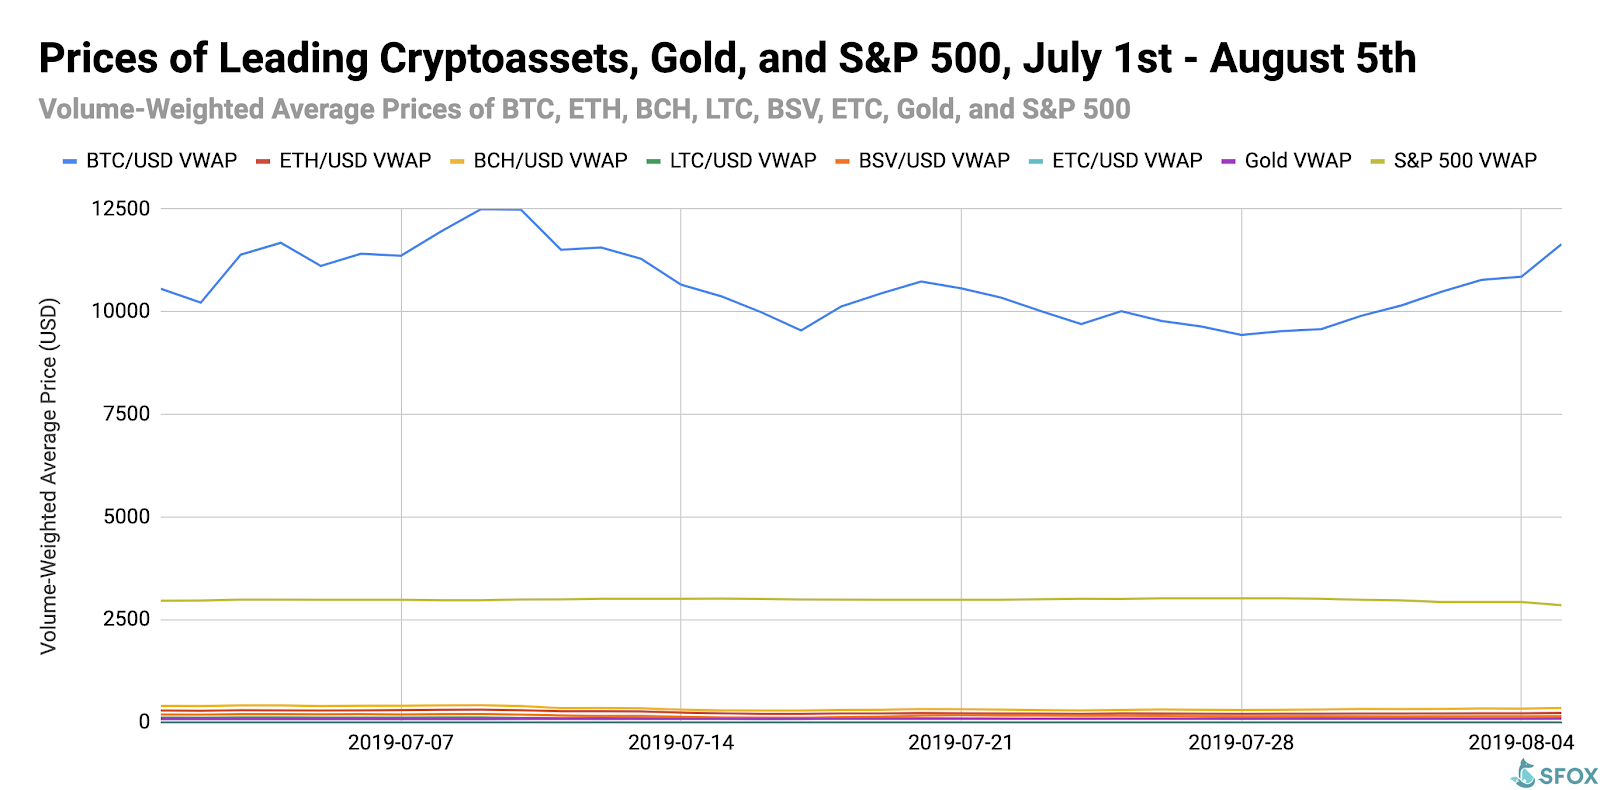
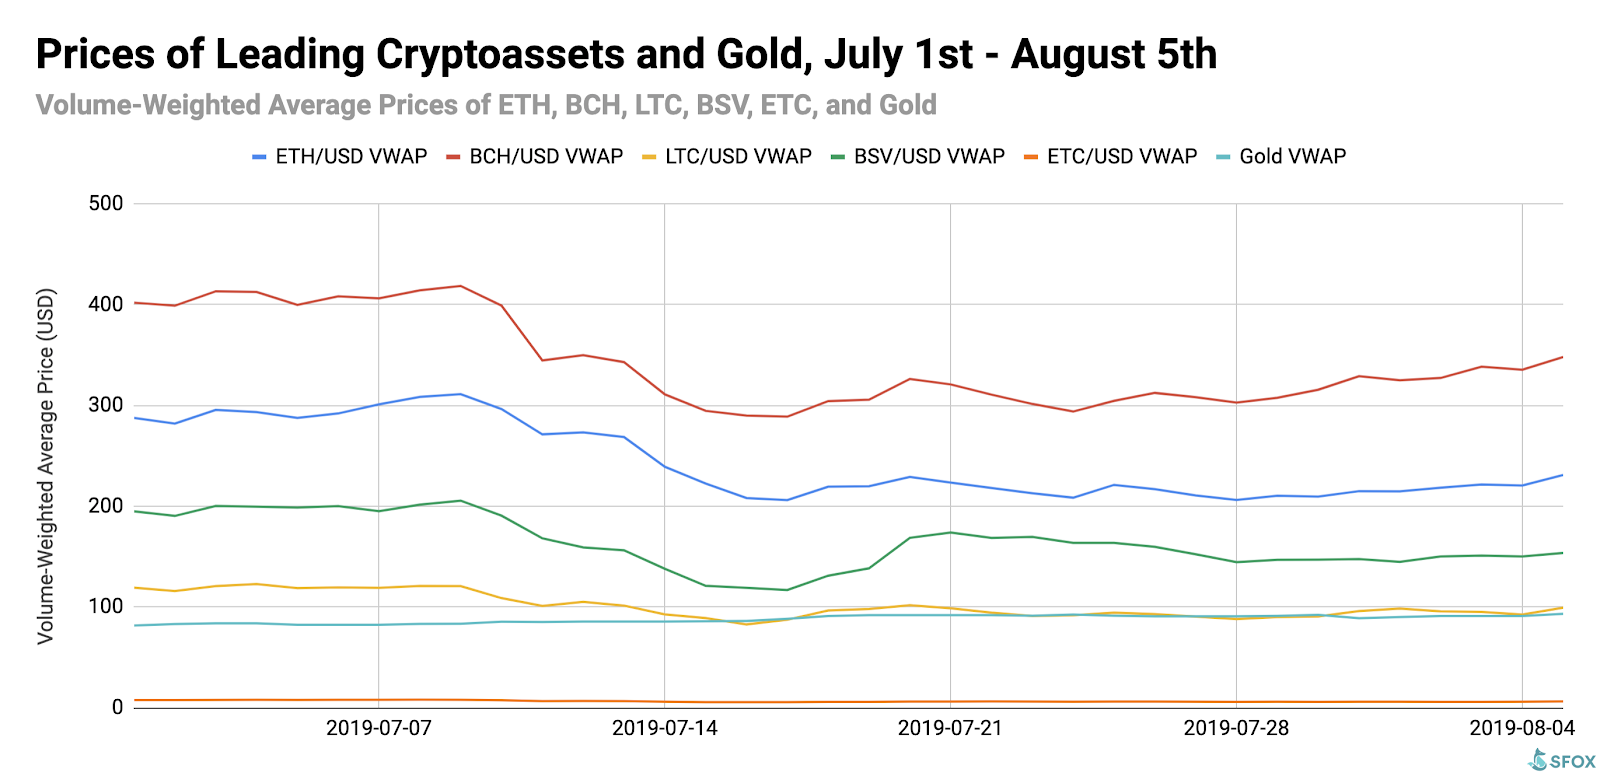
For greater graphical clarity on the rest of the market, see the following price chart omitting BTC and the S&P 500:
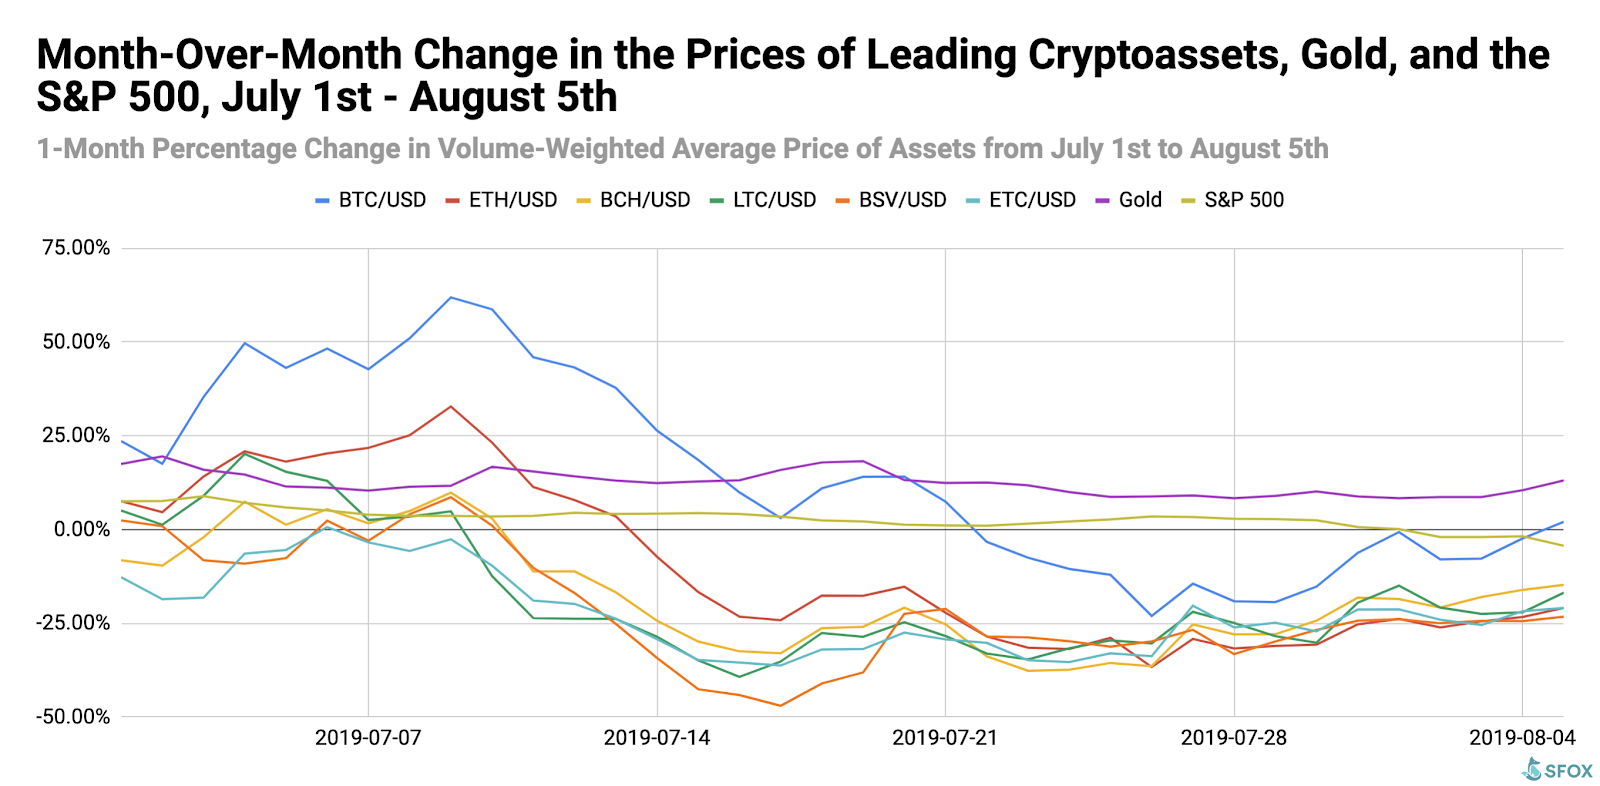
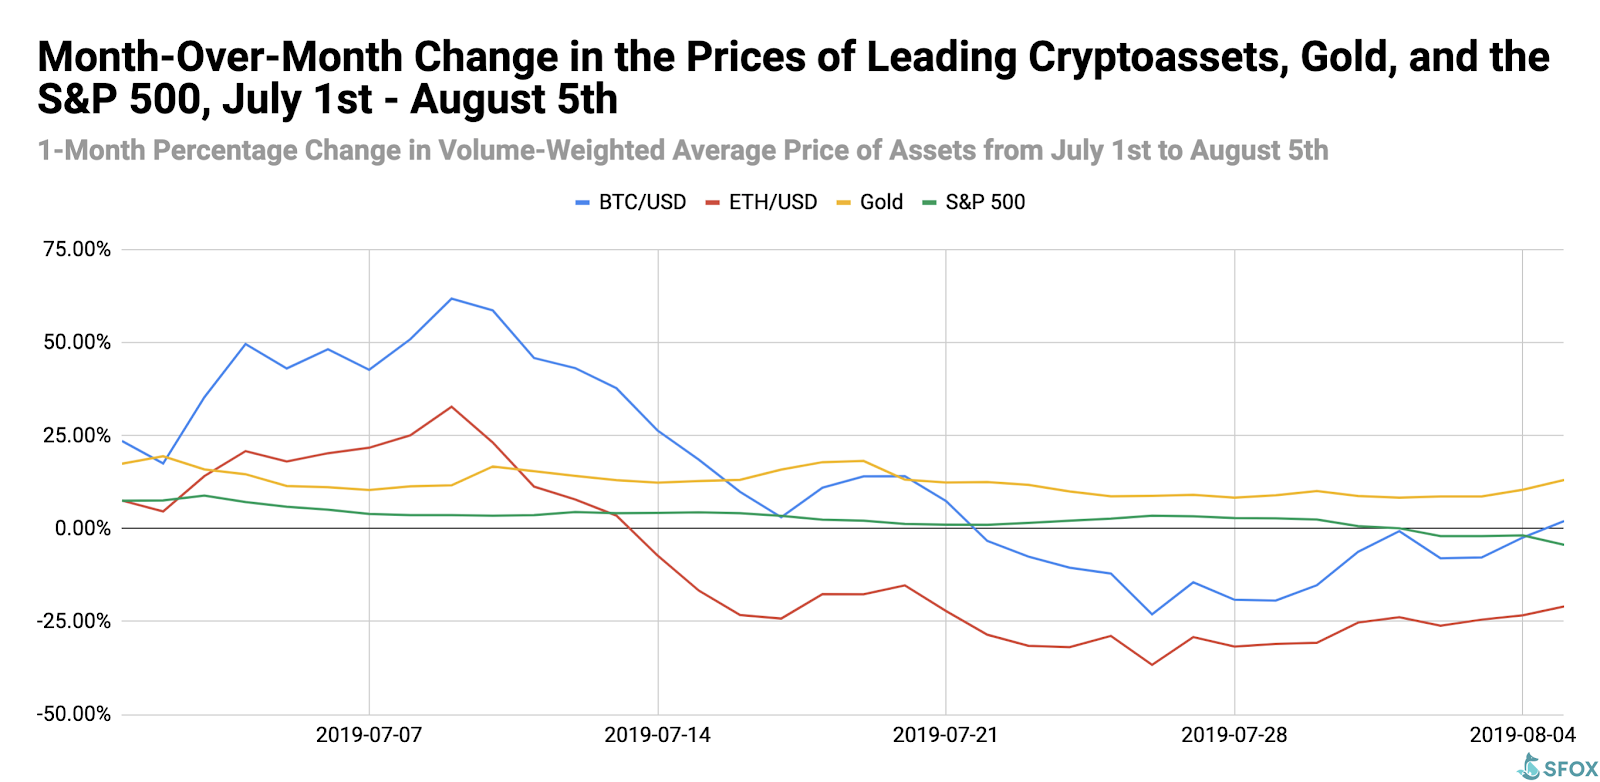
As of August 5th, BTC/USD led all asset pairs tracked by our report in month-over-month growth at 2.07%. All other tracked cryptoassets reported month-over-month losses on August 5th, with BSV/USD being down the most (-23.22%). The S&P 500 was down 4.33% month-over-month on August 5th. Gold has the distinction of being the only tracked asset that consistently showed positive month-over-month growth throughout the past month.
For greater graphical clarity, see this additional chart tracking only the month-over-month changes in the prices of BTC, ETH, gold, and the S&P 500:
Volatility: A Bitcoin-centric Story
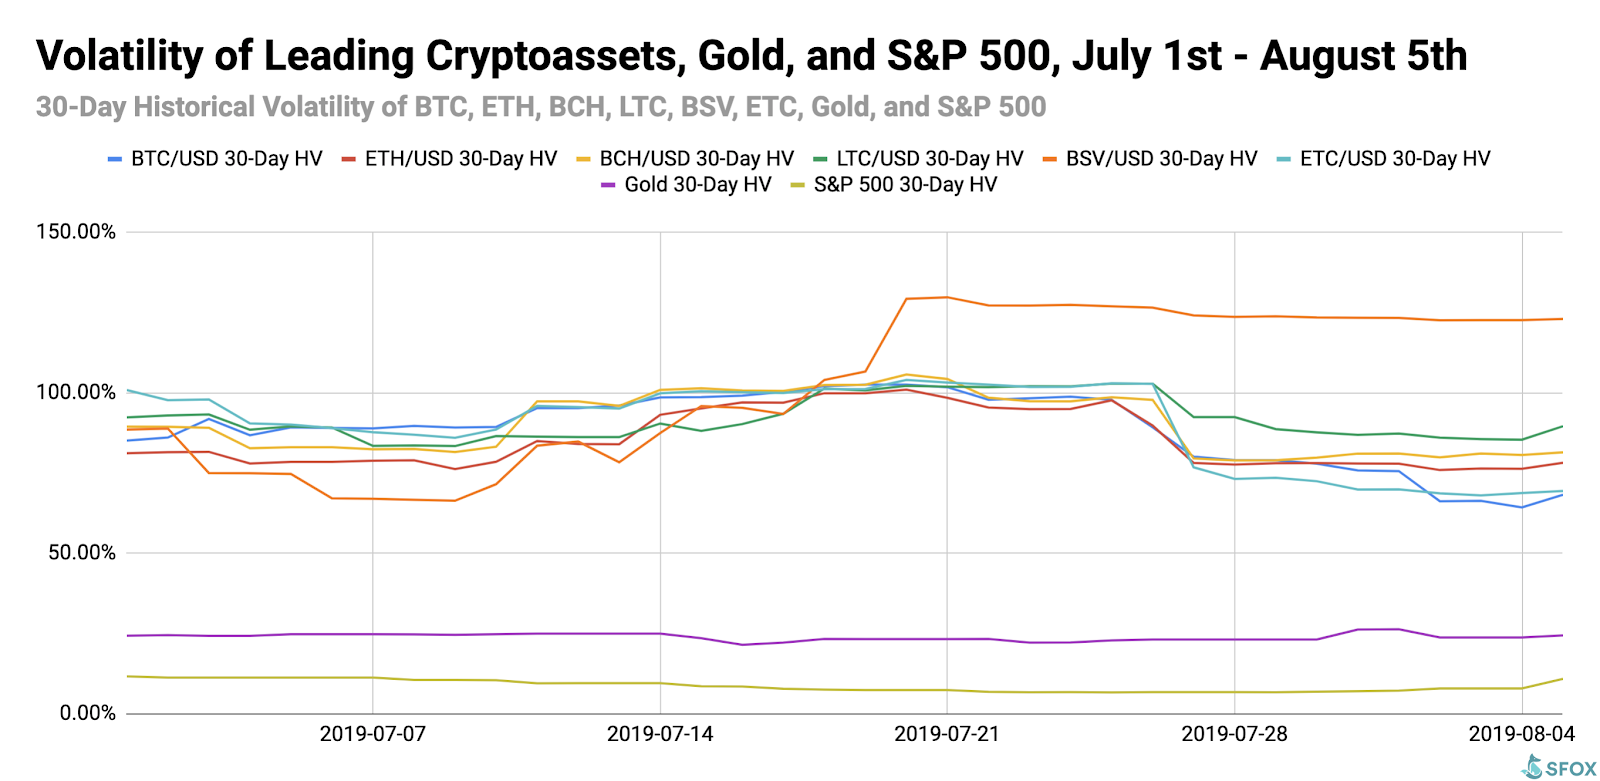
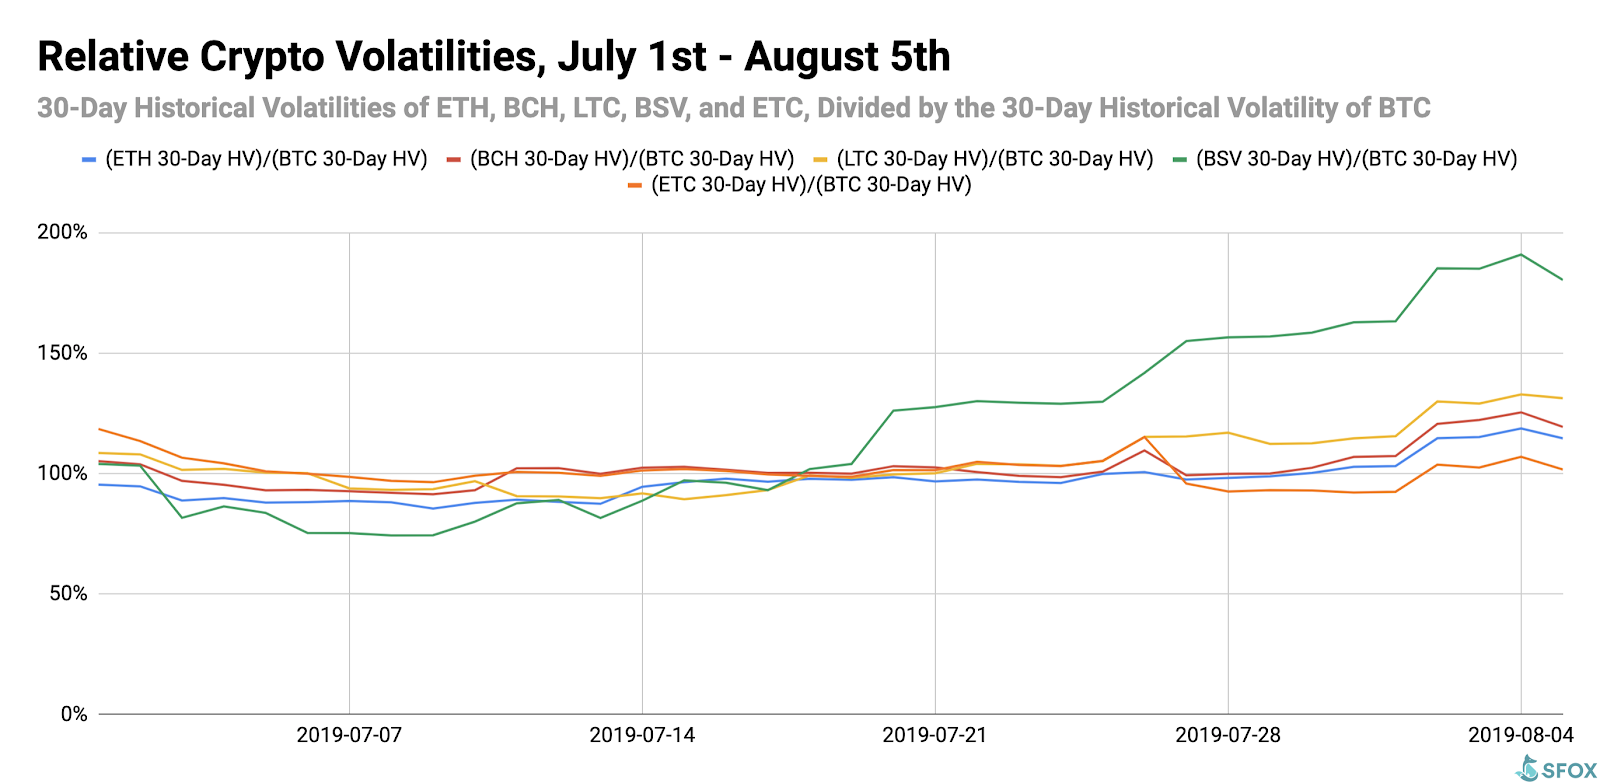
By looking at the 30-day historical volatilities of BTC, ETH, BCH, LTC, BSV, and ETC, we see that the volatility of most major cryptoassets formed a relatively tight band, coalescing around the 100% volatility mark between July 14th and July 26th before gradually decreasing and becoming more disparate.
Like last month, Bitcoin SV was the exception to this trend, experiencing disproportionately high volatility from July 20th onward. While it’s not entirely clear why its volatility spiked precisely on the 20th, it’s possible that its heightened volatility is the result of continued publicity over the protracted legal battles BSV affiliate Craig Wright is waging in relation to his allegation that he is Satoshi Nakamoto.
Price Correlations: Crypto as a Hedge
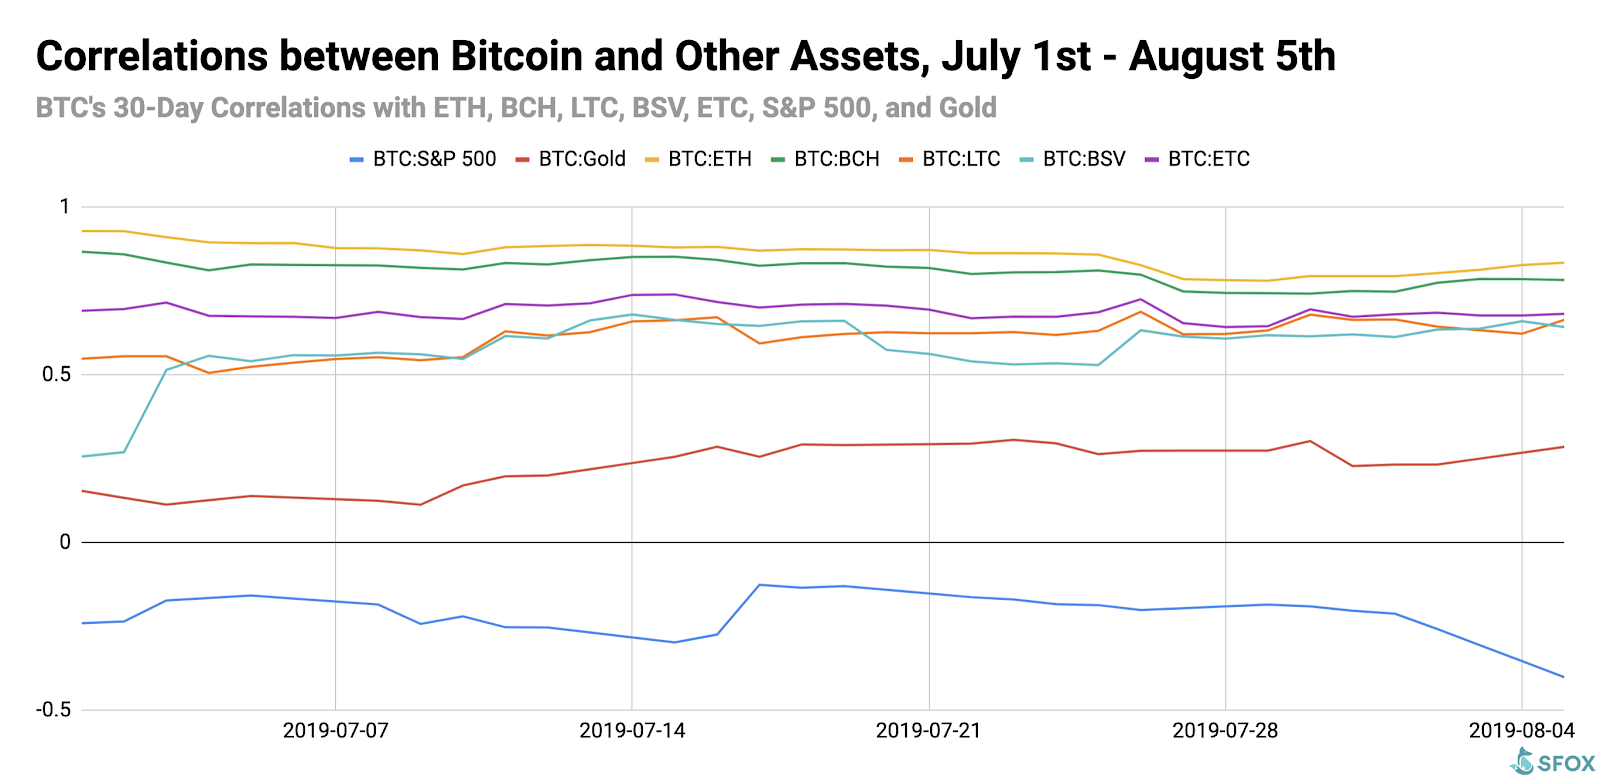
As discussed above, the most recent crypto correlations data show all leading cryptocurrencies negatively correlated with the S&P 500. Altcoins were positively correlated with BTC, with correlation values ranging from ETH:BTC at 0.834 to LTC:USD at 0.664.
For a full crypto correlations matrix, see the following chart:
For a more complete look at BTC’s correlations with other assets throughout the past five weeks, see the following graph:
Appendix: Data Sources, Definitions, and Methodology
We use two different in-house volatility indices in creating these reports:
1. 30-day historical volatility (HV) indices are calculated from daily snapshots over the relevant 30-day period using the formula:
30-Day HV Index = σ(Ln(P1/P0), Ln(P2/P1), …, Ln(P30/P29)) * √(365)
2. Daily historical volatility (HV) indices are calculated from 1440 snapshots over the relevant 24-hour period using the formula:
Daily HV Index = σ(Ln(P1/P0), Ln(P2/P1), …, Ln(P1440/P1439))* √(1440)
S&P 500 performance data are collected from Yahoo! Finance using GSPC (S&P 500 Index) data. Gold performance data are collected from Yahoo! Finance using XAU (Philadelphia Gold and Silver Index) data.
The cryptoasset data sources aggregated for crypto prices, correlations, and volatility indices presented and analyzed in this report are the following eight exchanges, the order-book data of which we collect and store in real time:
- bitFlyer
- Binance
- Bitstamp
- Bittrex
- Coinbase
- Gemini
- itBit
- Kraken
Our indices’ integration of data from multiple top liquidity providers offers a more holistic view of the crypto market’s minute-to-minute movement. There are two problems with looking to any single liquidity provider for marketwide data:
- Different liquidity providers experience widely varying trade volumes. For example: according to CoinMarketCap, Binance saw over $20 billion USD in trading volume in November 2018, whereas Bitstamp saw $2 billion USD in trading volume in that same time — an order-of-magnitude difference. Therefore, treating any single liquidity provider’s data as representative of the overall market is myopic.
- Liquidity providers routinely experience interruptions in data collection. For instance, virtually every exchange undergoes regularly scheduled maintenance at one point or another, at which point their order books are unavailable and they therefore have no market data to collect or report. At best, this can prevent analysts from getting a full picture of market performance; at worst, it can make it virtually impossible to build metrics such as historical volatility indices.
Building volatility indices that collect real-time data from many distinct liquidity providers mitigates both of these problems: collecting and averaging data from different sources prevents any single source from having an outsized impact on our view of the market, and it also allows us to still have data for analysis even if one or two of those sources experience interruptions. We use five redundant data collection mechanisms for each exchange in order to ensure that our data collection will remain uninterrupted even in the event of multiple failures.
The above references an opinion and is for informational purposes only. It is not intended as and does not constitute investment advice, and is not an offer to buy or sell or a solicitation of an offer to buy or sell any cryptocurrency, security, product, service or investment. Seek a duly licensed professional for investment advice. The information provided here or in any communication containing a link to this site is not intended for distribution to, or use by, any person or entity in any jurisdiction or country where such distribution or use would be contrary to law or regulation or which would subject SFOX, Inc. or its affiliates to any registration requirement within such jurisdiction or country. Neither the information, nor any opinion contained in this site constitutes a solicitation or offer by SFOX, Inc. or its affiliates to buy or sell any cryptocurrencies, securities, futures, options or other financial instruments or provide any investment advice or service.


