The mid-2018 plunge in Ethereum’s price caught many crypto investors by surprise. Cryptocurrencies are known for volatility, but this was something special: Ether lost 44% of its value in just two weeks, only to suffer even more losses as 2018 has continued.
Could this kind of crash occur again, dragging Ethereum down even further? To answer that question, you’ll need to understand the factors that determine Ethereum’s price.
Ethereum — and its representative coin, ether (ETH) — was not originally intended to be used as a currency or to have any more than a nominal value. Ethereum is “a blockchain with a built-in Turing-complete programming language, allowing anyone to write smart contracts and decentralized applications,” according to Vitalik Buterin’s initial white paper. That capability has led to new use cases for Ethereum, such as its use as a platform for ICOs (more on that in the next section).
Ethereum’s value today is tied to its ability to fulfill the promise of being a foundation for decentralized development as well as being a cryptocurrency. The triggers that can cause a price drop spring from both of these functions.
Trigger #1: ICOs and tokenization falter
In the world of crypto, a token is any digital asset built on top of a blockchain. Currently, there are over 1,000 actively traded tokens, the majority of which are built on Ethereum’s blockchain. Developers can use tokens as the basis for building a type of protocol called decentralized applications, or DApps, on the token’s blockchain.
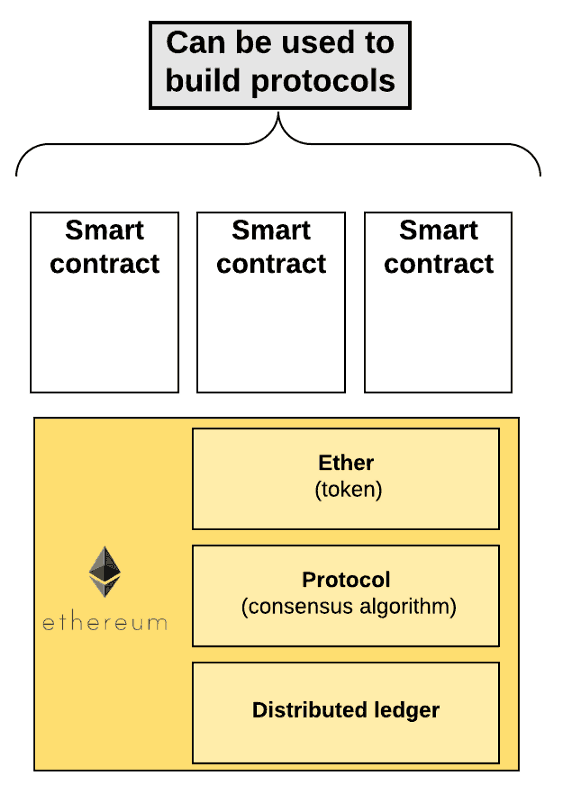
The majority of initial coin offerings (ICOs) use the Ethereum blockchain for two reasons:
1. Ethereum’s native protocol makes it easy to use smart contracts to build new tokens on top of its blockchain — what one might call “nonintrinsic” tokens, meaning that (unlike the “intrinsic” ETH) they weren’t originally part of that blockchain — which makes it an ideal platform for initial coin offerings. ICOs typically gain funding by selling their nonintrinsic tokens in exchange for ETH. If an ICO project is successful, the tokens may become valuable as a way to purchase the product or service, at which point investors can either use them or sell them to others. If a project fails, the tokens will become worthless, and investors may receive little or no return on their pre-ICO ETH donation.
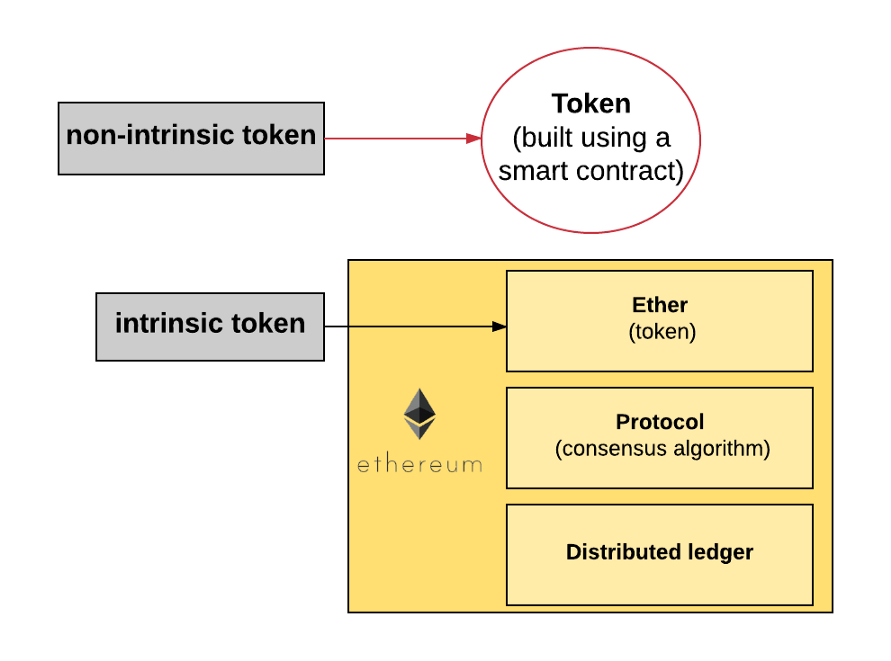
2. Building an ICO on the Ethereum blockchain also allows developers to take advantage of Ethereum’s “network effect.” ETH is a popular investment, so fundraising ICOs can tap into the large pool of existing ether holders for fundraising purposes. As a result, ICOs can be an effective fundraising mechanism both for Ethereum-based tokens (for example, Gnosis and Augur) and for tokens built on entirely new blockchains (for example, EOS). The latter ICOs can use Ethereum for fundraising by selling their own tokens in exchange for ETH via smart contract.
When a large number of ICOs (or a few heavily hyped ones) are in the works, people will likely buy quantities of ETH so that they can invest in said ICOs — which may drive up the price of ETH, courtesy of the law of supply and demand. For example, Block.one investors had contributed over 7 million ETH by June 2018. The total ETH supply today is just under 103 million, so that one ICO tied up almost 7% of the entire supply.
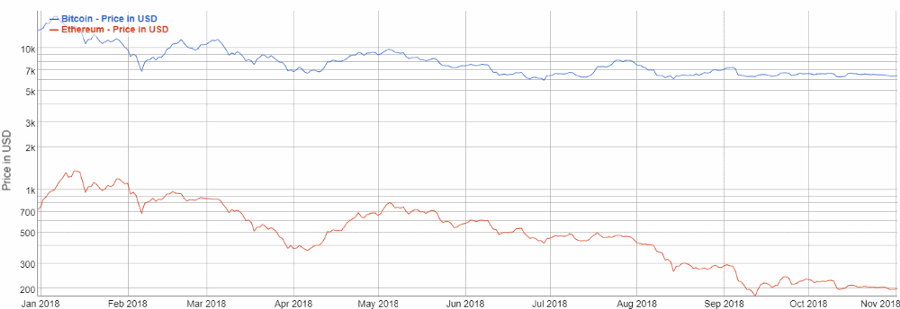
Note how ETH’s 2018 price peaked in May and has been trending down ever since. That timing matches Block.one’s ICO quite closely.

There was a total of 875 ICOs in 2017, bringing in over $6.2 billion USD in funding (by contrast, in 2016, there were a mere 29 ICOs). That’s an enormous amount of ETH passing back and forth between investors and ICOs.
When interest in ICOs wanes, investors no longer need to buy up large quantities of ETH for that purpose. For that matter, when an ICO is complete, the new company is likely to sell off much (if not all) of its ETH holdings to get the fiat money it needs for operations. Again, Block.one (the creator of EOS) is a good example of this type of activity.
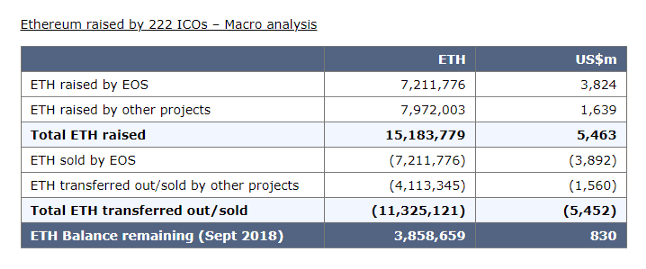
The sell-offs on both counts that occurred in 2018 likely contributed to the substantial Ethereum price drop reflected in the above price chart.
“ICO fever” is only one potential cause for interest in ICOs rising and falling (and the price of ETH with it). For example, the SEC considers most ICOs to be security offerings, and the agency has issued numerous subpoenas to ICO issuers and cryptocurrency funds in order to investigate their compliance with federal securities laws. This kind of increased regulatory scrutiny on crypto has the potential to temper ICO interest, both on the side of ICO issuers and on the side of ICO investors.
Trigger #2: DApp usage plummets
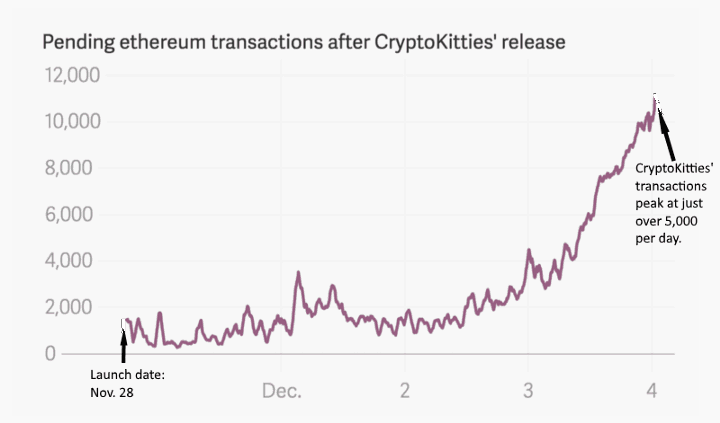
Ether’s primary purpose is to serve as a native currency for the blockchain network to power computing via smart contracts, which developers can use to build DApps. CryptoKitties was the first such DApp to go viral, but it failed to sustain its initial usage levels or to achieve mainstream adoption: even though it holds one of the top 10 ether contracts by transaction volume, it has only around 400 users per day, according to DappRadar.
DApps have great potential, but they face substantial hurdles in these early days:
- Usually, DApp users must first purchase the DApp’s own token before they can use the program. Right now, the relatively technical and unintuitive process of buying and using tokens consequently poses a significant barrier to entry. Remember, the majority of DApps are built on Ethereum, so users must convert ETH in order to get the DApp’s own tokens — they can’t just use fiat currency. Some DApps use ETH rather than creating their own tokens, but that still requires users to buy ETH to use the DApp.
- A second major hurdle relates to Ethereum’s scalability. The Ethereum network is currently slow and inefficient, so as DApp usage increases, those users must spend more ETH simply to complete a transaction. For example, during the brief CryptoKitties craze in late 2017, a mere 27,000 users were enough to bog down the Ethereum network’s processing ability. The Ethereum network needs to be able to process more transactions per second before it can support high DApp usage. Developers are well aware of this limitation, and many are working on projects to improve Ethereum’s scalability, including Casper and Raiden Network.
- Finally, transaction fees present a third hurdle for ICOs. Each transaction DApp users generate costs a certain amount of gas. Thus far in 2018, users have averaged 707,766 transactions per day. The average cost per transaction was 0.0976 ETH, which at today’s prices is worth about $8.70 USD. However, during times when Ethereum’s price skyrockets, transaction fees can become prohibitively expensive. For example, in mid-January 2018, Ethereum hit a peak of $1359.48 USD. That means a transaction fee of 0.0976 ETH on that day would have cost users $132.69 USD. If users can’t predict how much a transaction will cost from one day to the next, they could be nervous about committing to heavy DApp usage.
Thus far, DApp usage has remained quite low. As of this writing, of the 1,137 existing Ethereum-based DApps, only two — IDEX and ForkDelta — had more than 1,000 users in the past 24 hours (and both of these DApps are decentralized exchanges). Of course, DApps are still very new: cryptocurrency itself has just barely begun to achieve mainstream acceptance, and most DApps have been around for only about a year. But, as the below chart shows, usage of all DApps put together peaks at fewer than 34,000 users per day and is usually far lower.
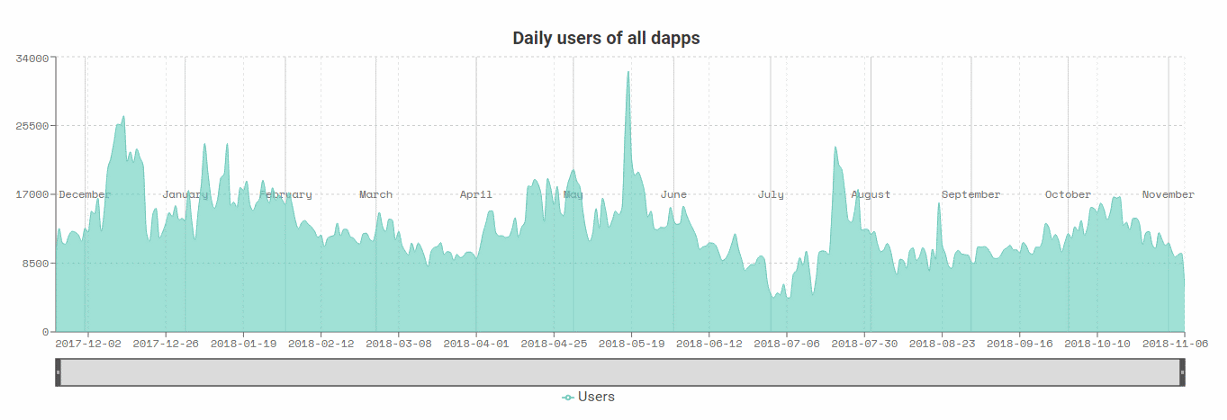
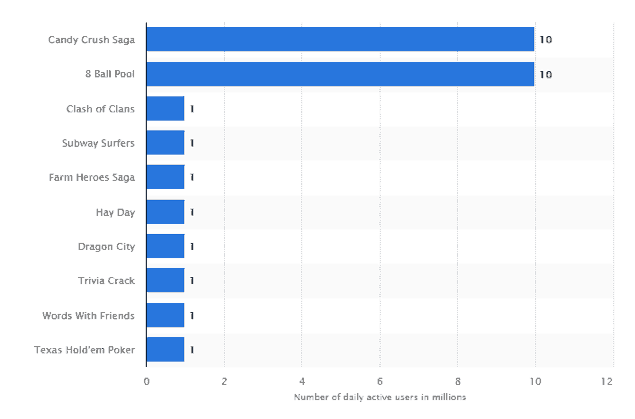
The DApp usage chart has another story to tell besides low usage rates. Its portrayal of DApp usage demonstrates that said usage is prone to dramatic peaks and equally dramatic troughs. As hot new DApps are released or old ones catch the public’s eye, the sudden surge of interest can inspire new users to buy ETH for access to said DApps — and when interest drops again, so does the need to buy up ETH. This could easily result in major swings in ETH’s price.
Trigger #3: The cryptocurrency market plummets
When Vitalik Buterin first launched Ethereum into the world, he may not have intended for ether to gain high intrinsic value, but that’s how events have played out. As a result, ETH’s price is subject to the same market factors that can raise and lower the value of BTC and other cryptocurrencies.
Factors that can affect the overall crypto market include:
- FOMO (fear of missing out), which can inspire massive buying and create a steep rise in price.
- FUD (fear, uncertainty, and doubt), the opposite of FOMO, which tends to generate selloffs and crashes.
- Increasing (or decreasing) regulation, which can push prices either up or down depending on whether the regulation in question is considered positive or negative by crypto investors.
- Changes to supply: when a large number of new coins are minted, the price of the currency is likely to drop, all else being equal.
- Expert opinions that predict either a bear or bull market in the near future, triggering wide-scale buying or selling by investors who follow those experts.
For that matter, ups and downs in BTC — and, to a lesser extent, ETH — can trigger similar behavior in other cryptocurrencies. As the below chart shows, ETH, BCH, and LTC prices all tend to be highly correlated with BTC and with each other.

So it’s not surprising that even though Bitcoin and Ethereum are quite different in nature and are priced at different levels, their overall performance so far in 2018 has followed a very similar pattern.
What do Ethereum price drops mean?
We can’t ever really know with certainty what leads to a specific Ethereum price drop, but the above triggers can give us a good framework to think about those price drops based on what Ethereum is. Similarly, a framework for understanding Ethereum price drops isn’t especially useful unless one also has a framework more thinking about the fundamental value of Ethereum.
Cryptocurrency is a relatively new asset class, and as such, it makes sense to begin the question of valuation practices here by looking to a standard framework that many analysts use elsewhere: discounted cash flow (DCF) analysis. Although DCF analysis has some fundamental flaws, it is a well-understood valuation method; and one which an analyst might use to valuate an asset like Ethereum.
The capital asset pricing model and discounted cash flow (DCF) analysis
A discounted cash flow (DCF) analysis estimates the current value of an asset based on its projected future cash flows. Because cash generated in the future is worth less than cash generated today (thanks to the time value of money), it’s necessary to calculate the present value of this future cash flow.
DCF analysis is typically used for valuating companies; technically, cryptocurrencies don’t have “cash flows,” which makes the use of DCF analysis questionable from the get-go. However, one can look for a proxy of cash flows and use that to motivate the analysis.
In this example DCF, we’ll consider “gas flows”—the inputs of gas to the Ethereum network—as a proxy of cash flows. The thought here is that, just as cash flows represent a company’s ability to create value, so does gas—the fees paid in ETH to cover the computational effort of operations on the Ethereum network—represent the ability of Ethereum to create value. It’s worth noting upfront, though, that this is only a loose analogy: if one were to choose a different cash flow proxy for a blockchain DCF analysis, one’s subsequent calculations would vary accordingly.
When conducting a DCF analysis, one needs to incorporate a “discount rate,” which essentially takes into account the riskiness of an asset. We can use a widely used tool, the capital asset pricing model (CAPM), to generate an appropriate discount rate for this valuation:
E(Ri) = Rf + Bi (E(Rm) — Rf)
E(Ri) is the discount rate: a risk-adjusted rate at which to discount future cash flows to present value.
Rf is the risk-free rate (the actual rate of return on a risk-free investment, typically a government bond yield; for this calculation, we’ll the 10-year U.S. treasury bill rate of 3%).
E(Rm) is the expected return of a benchmark (often a broad market benchmark); here, we will be using the S&P 500 as a proxy. We will use an E(Rm) of 10%, the average annual return of the S&P 500.
B is beta (how volatile the asset is compared to its benchmark). Ethereum’s beta compared to the S&P 500 is 1.5, based on its behavior from January 2017 to mid-November 2018, calculated via OLS regression.
Using these assumptions, this equation yields a discount rate of 14.5% for ETH.
E(R ETH) = 3% + 1.5(10% — 3%) = 14.5%
The next step in a DCF analysis is to calculate the annual “cash flow” of Ethereum. Here are the data needed to determine the total price of gas expended on Ethereum, using gas figures provided by Etherscan:

At this point, DCF analysis requires one to make certain growth assumptions and see whether they produce realistic results for a price of ETH. For example, the below table shows DCF analysis of the current price of ETH based on three different assumed high growth rates over the next five years, assuming that ETH’s growth rate will linearly decrease to a stable rate of 10% in the five years thereafter.

Note that this table is only one imperfect example of how a DCF analysis could be run for Ethereum: there are other levers one can pull, to modify the final ETH price output (e.g., assumed stable growth rate, number of years at high growth rate, benchmark used for E(Rm)). In this example, we’ve only played with one lever: the high growth rate for Ethereum.
Like any analytical framework, the devil is in the details of the assumptions one makes when building one’s model: a different assumed growth rate or benchmark could significantly alter what the model calculates as a current fair price for ETH. One could use various assumptions to arrive at a “fair” valuation for ETH, which could, in turn, lead one to various buy/sell decisions in one’s portfolio.
Opponents to DCF crypto analysis also argue (and rightly so) that because these pseudo cash flows are provided in the native currency (in our example, gas fees are in ETH), it’s anywhere from difficult to incoherent to assign them a fair value in USD. One could think of this as receiving cash flow in foreign currency and applying a foreign exchange rate to it. One option to convert them to USD is by using current market prices, but it’s not a perfect approach: using the market rate to calculate that same asset’s price is a bit circular.
In short, DCF analysis may not be a perfect fit for valuating crypto, but it can provide a basic analytical framework until a better method of crypto valuation is standardized.
The future of Ethereum
ICO activity, DApp usage (or lack thereof), and market pressures may seem plausible as current triggers of Ethereum price drops, but other factors could also arise and yield similar effects in the future.
For example, Ethereum is no longer the only option for building DApps: EOS and other competitors have begun to grab some of the DApp market share. These competitors operate on their own blockchains, using different approaches to manage transactions in order to address scalability, processing time, and similar issues. If one of these alternative cryptocurrencies were to attract a large percentage of DApp developers, it could potentially draw investors away from ETH, leading to a price drop.
Understanding how all of those factors can cause an Ethereum price drop can help you prepare for the next plunge.
The above references an opinion and is for informational purposes only. It is not intended as and does not constitute investment advice, and is not an offer to buy or sell or a solicitation of an offer to buy or sell any cryptocurrency, security, product, service or investment. Seek a duly licensed professional for investment advice. The information provided here or in any communication containing a link to this site is not intended for distribution to, or use by, any person or entity in any jurisdiction or country where such distribution or use would be contrary to law or regulation or which would subject SFOX, Inc. or its affiliates to any registration requirement within such jurisdiction or country. Neither the information, nor any opinion contained in this site constitutes a solicitation or offer by SFOX, Inc. or its affiliates to buy or sell any cryptocurrencies, securities, futures, options or other financial instruments or provide any investment advice or service.


