Summary:
- Our new price charts show you volume-weighted average prices of BTC, ETH, BCH, and LTC aggregated from every exchange SFOX trades on.
- Large arbitrage opportunities make it valuable to look at an integrated order book — and they also make an integrated candlestick chart virtually unreadable.
- We monitor exchange data using five redundant collection services per exchange to ensure uninterrupted data streams.
- Look for more data products and new data-trained, market tested algorithms in the months to come.
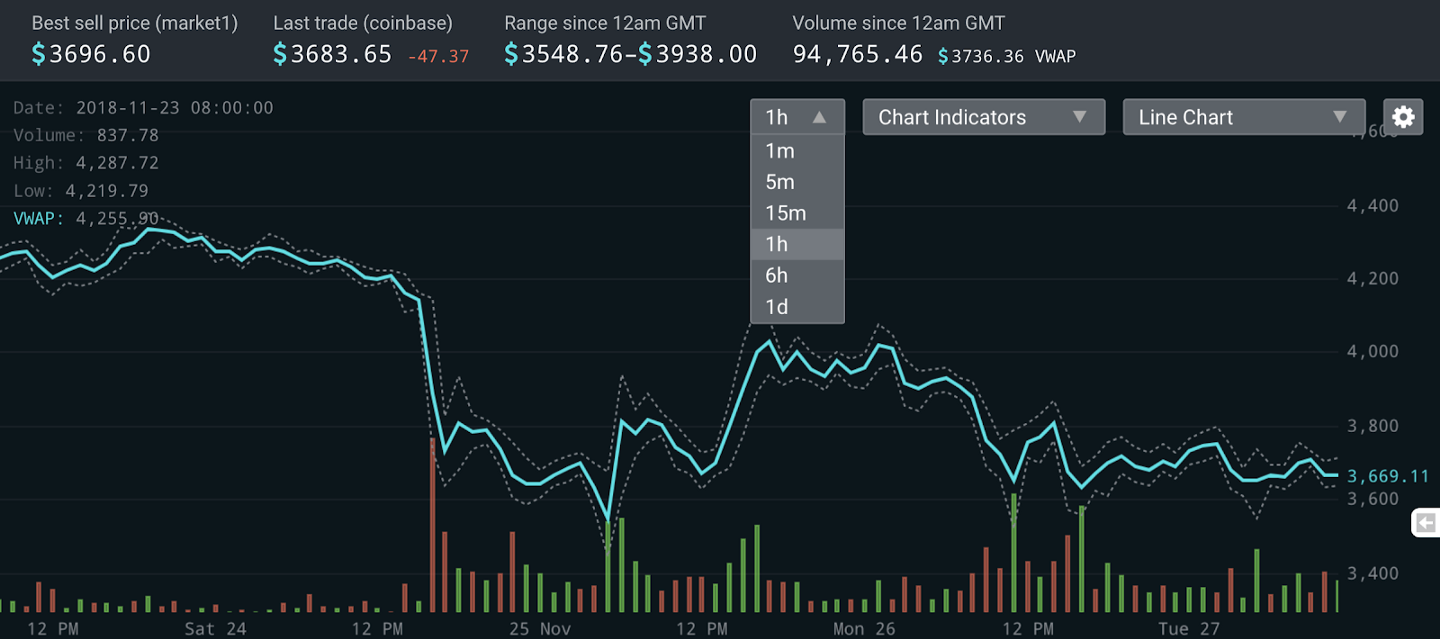
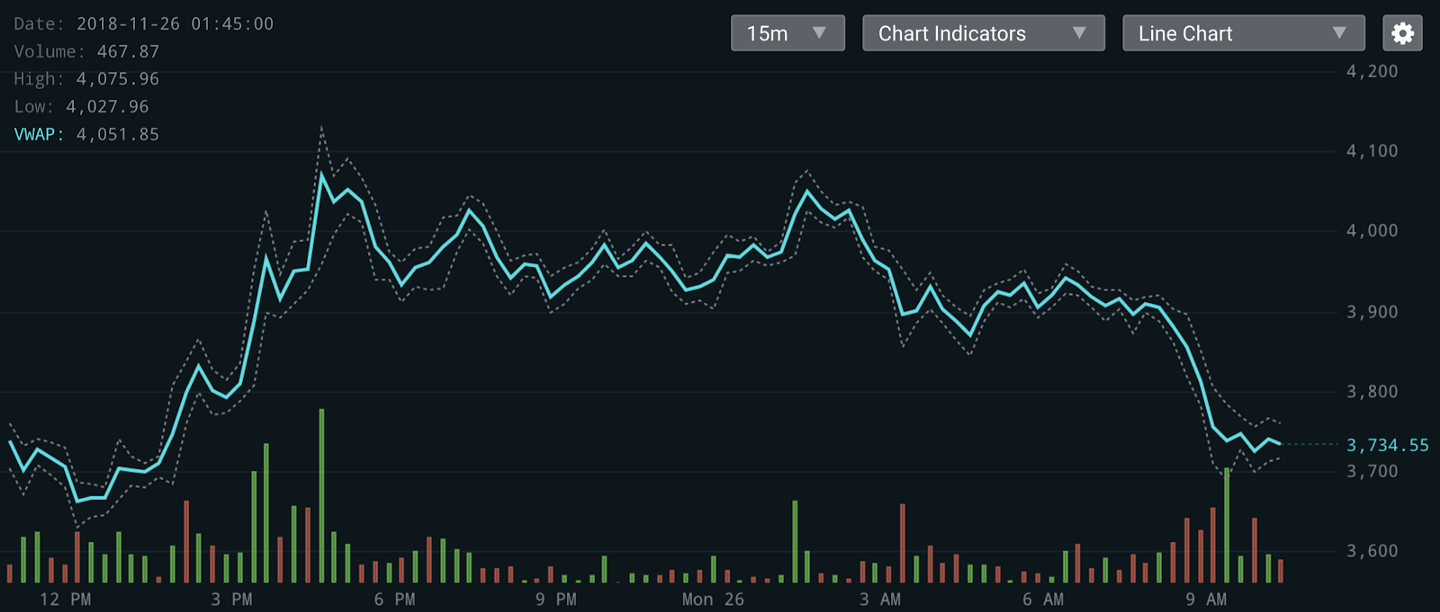
One of our principal goals at SFOX is equipping our users with tools that allow them to see and capitalize on the full picture of the crypto market at any given time. That’s the ethos behind our integrated order book, which lets SFOX users trade across multiple major liquidity providers at once, and it’s what inspired our latest product: charting software that lets you see the performance of BTC, ETH, BCH, and LTC across the entire crypto market.
You can sign into your SFOX account to check out these charts on your dashboard right now. We also wanted to take a moment to give you a look into what the development process looked like for this new feature — because, as we were building this charting software, we gleaned some important insights about the current challenges facing data collection and analysis in crypto.
A Little Less Giant Candles…
The first thing you’ll notice about our charts is that they don’t include a candlestick option, which one might assume is table-stakes for a trading platform.
We did include a candlestick version in an earlier prototype of the charting software… and this is what it looked like:

There’s nothing wrong with your screen — that’s really what the candles looked like!
This unusual graph turned out to be a consequence of the arbitrage opportunities within our integrated order book. The “problem” is that different exchanges execute trades at different price points all the time, and so looking at multiple order books can reveal huge arbitrage opportunities between different exchanges in any time interval. While there is certainly a time and a place to highlight arbitrage, it’s not in this kind of chart: those giant candles don’t convey much useful information about the price range in which cryptoassets traded.
The charts of individual exchanges might offer tidier-looking candles, but our experience of trying to chart integrated candles shows why you should doubt those tidier charts: each exchange’s charts only reflect a small fraction of the total crypto market. An exchange’s charts might look simpler and cleaner than the monstrous candles in the above picture, but if you’re relying them for your view of the overall market, you might be missing the forest for the trees. (Or, at least, missing the cake for the candles!)
Building a High-Availability Crypto Charting Tool
Once we’d decided to forego a candlestick chart in favor of a line chart showing volume-weighted average price, low price, and high price, we needed to build a way to reliably collect and report price and volume data from all of the exchanges integrated on our platform. This required us to answer two questions:
- Are exchanges consistently reporting their own data?
- How reliable are our own services for collecting and reporting exchanges’ data?
An obvious challenge with Question #1 is that any given exchange experiences a combination of planned and unplanned downtime, which can interrupt their trading and consequently their market data. A less obvious challenge is that there’s no current standard for data collection and normalization practices across crypto exchanges: different exchanges expose their data differently — for instances, some send an ID with their data, while others don’t. This meant we had to find the best practices for normalizing exchange data before we could even think about collecting and storing it.
We focused on developing reliable, high-availability data collection systems in order to minimize the impact of these limitations. Ultimately, we opted to do this by writing real-time exchange data redundantly into our proprietary database, ensuring that we experience minimal downtime in data aggregation, even when particular exchanges experience downtime.

Champions of redundancy often repeat the mantra that “two is one, and one is none.” In the world of crypto analytics, we’ve found that two data sources are still insufficient to ensure reliable data collection: we monitor each crypto exchange with five redundant data collection services and writing those data into our pipeline. The result is a real-time database of marketwide crypto information that remains stable despite the risk of multiple failures.
Now, when we want to analyze any aspect of the crypto market, we can craft a new query and survey our entire database of historical data in a matter of seconds.
The Future of Data Analysis on SFOX
We’re most excited about our new charting feature because it represents Day 1 of marketwide data analysis at SFOX (and not just because we’re using AWS!).
With our data collection and storage system in place, we’re now able to collect and store real-time, tick-by-tick order data from every exchange integrated with our platform. The ability to share and analyze this data will open up new horizons to the SFOX community. Not only will we be able to analyze the historical marketwide performance of cryptoassets like BTC, ETH, and BCH, but we will also have a huge store of real, fine-grained market data to use when we’re vetting the performance of our trading algorithms — or when we’re engineering totally new algorithms to keep up with our clients’ needs in a constantly evolving sector.
We look forward to sharing many more data-driven products with you in the months to come.
The above references an opinion and is for informational purposes only. It is not intended as and does not constitute investment advice, and is not an offer to buy or sell or a solicitation of an offer to buy or sell any cryptocurrency, security, product, service or investment. Seek a duly licensed professional for investment advice. The information provided here or in any communication containing a link to this site is not intended for distribution to, or use by, any person or entity in any jurisdiction or country where such distribution or use would be contrary to law or regulation or which would subject SFOX, Inc. or its affiliates to any registration requirement within such jurisdiction or country. Neither the information, nor any opinion contained in this site constitutes a solicitation or offer by SFOX, Inc. or its affiliates to buy or sell any cryptocurrencies, securities, futures, options or other financial instruments or provide any investment advice or service.


