In the May 2019 edition of our monthly volatility report, the SFOX research team has collected price, volume, and volatility data from eight major exchanges and liquidity providers to analyze the global performance of 6 leading cryptoassets — BTC, ETH, BCH, LTC, BSV, and ETC — all of which are available for algorithmic trading on our trading platform.
The following is a report and analysis of their volatility, price correlations, and further development in the last month. (For more information on data sources and methodology, please consult the appendix at the end of the report.)
Current Crypto Market Outlook: Uncertain
Based on our calculations and analyses, the SFOX Multi-Factor Market Index, which was set at mildly bullish at the beginning of May 2019, has moved to uncertain at the beginning of June.
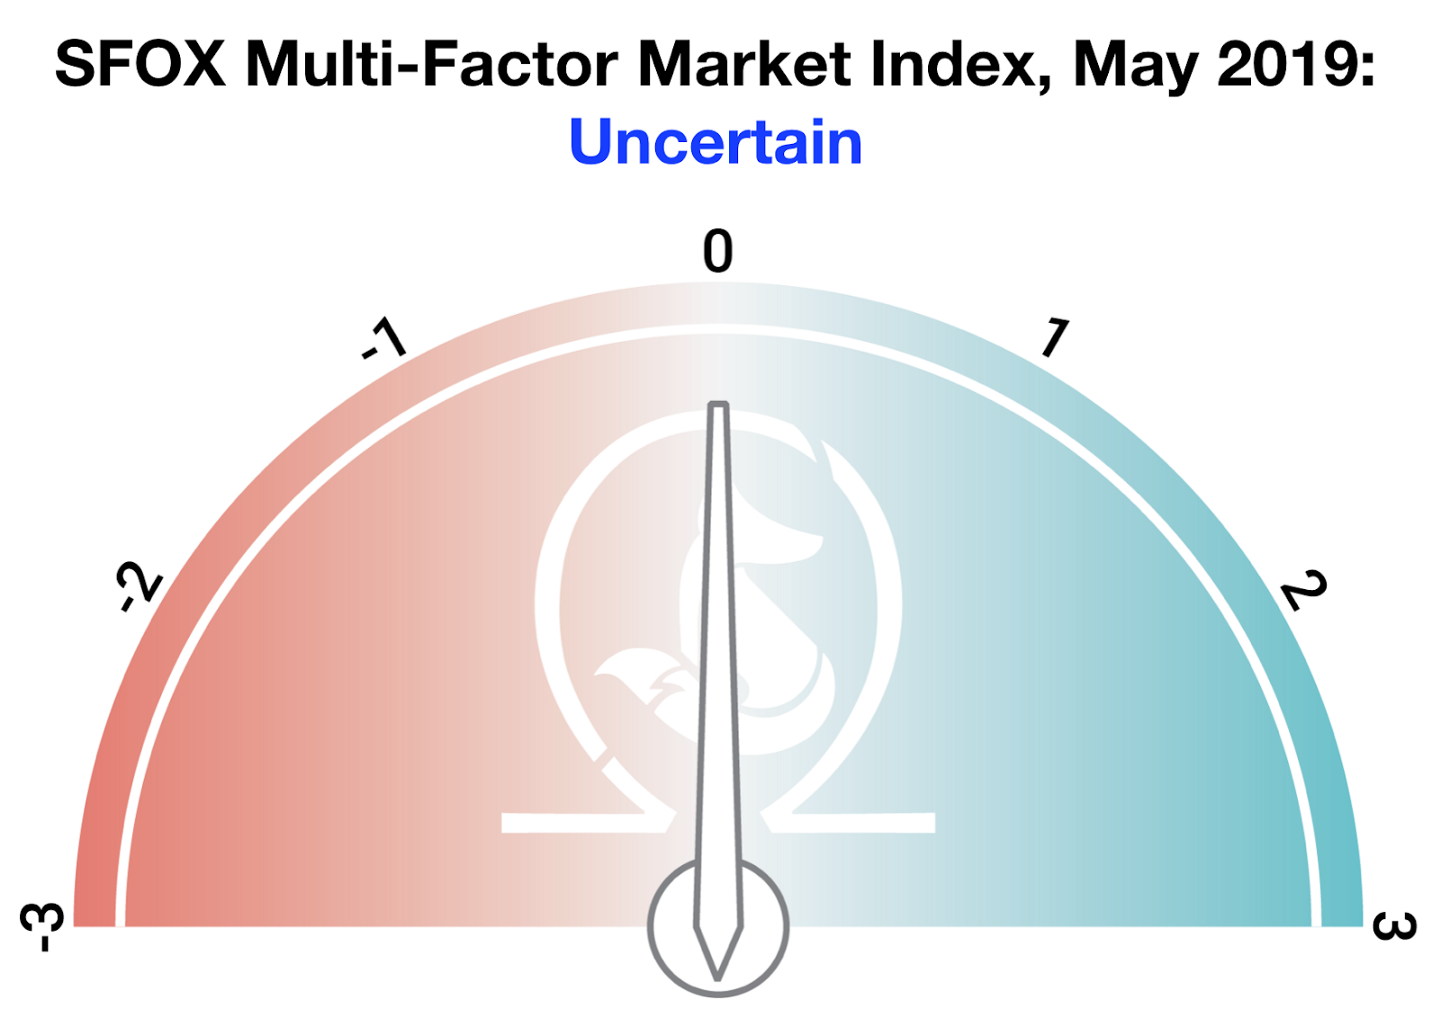
We determine the monthly value of this index by using proprietary, quantifiable indicators to analyze three market factors: price momentum, market sentiment, and continued advancement of the sector. It is calculated using a proprietary formula that combines quantified data on search traffic, blockchain transactions, and moving averages. The index ranges from highly bearish to highly bullish.
While the crypto market as a whole recovered substantially in May 2019, the overall sentiment appears to be at a tipping point: especially in the wake of the explosive late-2017 rally, it’s not clear in times of rapid growth how much of the growth is due to underlying fundamentals and how much is due to “fear of missing out,” or “FOMO.” This may be why the growth we’ve seen lately has been accompanied by renewed volatility and substantial swings in the prices of leading cryptoassets such as BTC.
Analysis of May 2019 Crypto Performance
In May of 2019, market movements suggested that investors may be eyeing BTC as a hedge against the S&P 500 and other markets tumbled amid trade disputes. At the same time, unexpected events on particular cryptocurrency exchanges indicated that, while the crypto market has come a long way in terms of maturing infrastructure, it still has further to go.
BTC’s nearly perfect negative correlation with the S&P 500 suggests that some traders may be using it as a hedge amidst ongoing global trade disputes (May 13th-May 31st).
May marked one of the most tumultuous months for global markets in recent history as U.S.-China trade relations continued to strain. On Monday the 13th, as China announced that it would raise tariffs on roughly $60 billion of U.S. goods, the S&P 500 fell 1.7% and the Chinese yuan reached a four-month low. At the same time, BTC rose 7%, from $7158.34 to $7679.21. From that point onward in the month, BTC approached a nearly perfect negative correlation with the S&P 500, while its correlations with leading altcoins became almost perfectly positive:
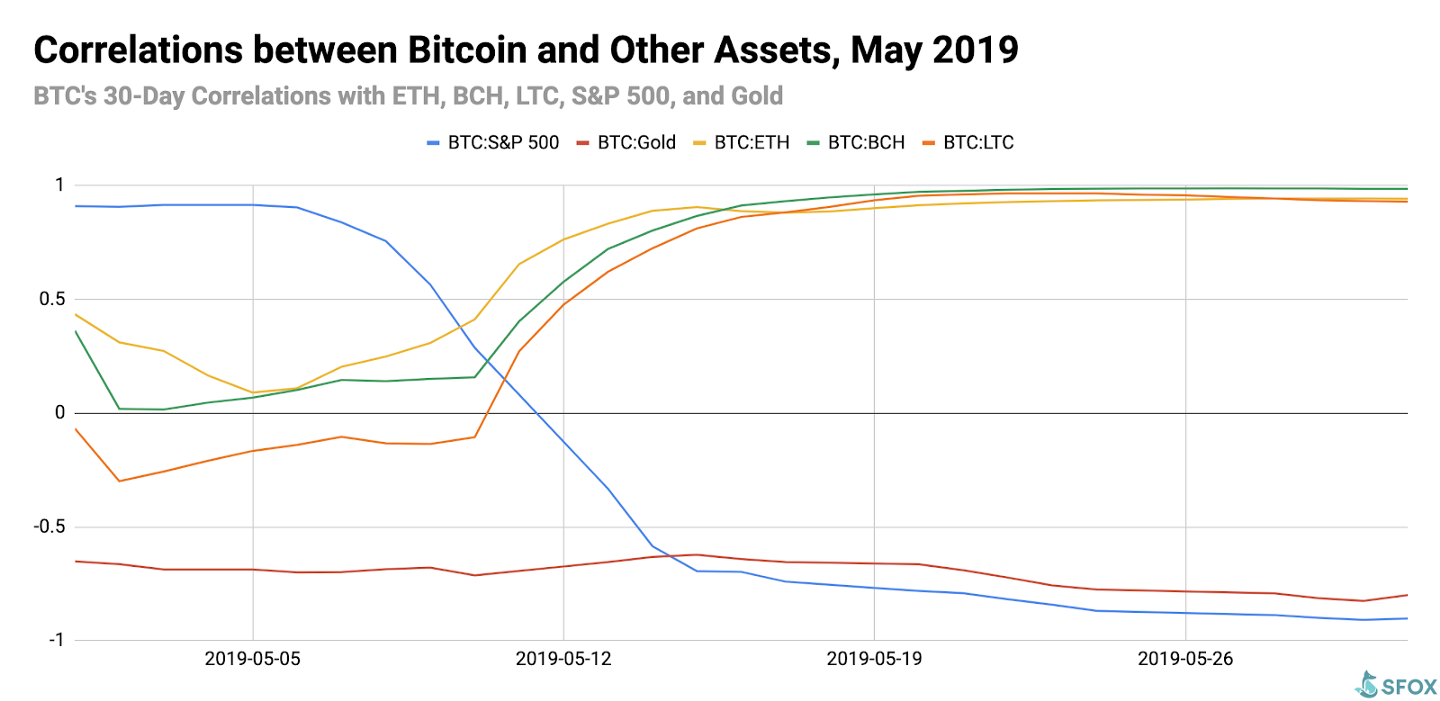
These correlation data corroborate the view that some investors may be using BTC as a hedge against global markets. BTC’s typically low correlation with other markets may make it appealing to some as such a hedge, and the fact that altcoins followed BTC during this time suggests that those investors using crypto as a serious hedge may still be defaulting to BTC, despite the continued maturation of the crypto sector beyond BTC. This highlights the potential for BTC to function as a unique hybrid of gold’s status as a store of value and the S&P 500’s status as a risk asset.
Broader market movements may have overshadowed ETF news (May 15th & May 20th).
Last month, the SFOX Volatility Report commented that anticipated SEC responses around the two Bitcoin ETF proposals — the Bitwise proposal and the VanEck proposal — could potentially impact the market, as ETF news had done in the past. This didn’t end up being the case: when the SEC postponed its decision on the Bitwise ETF proposal with a five-week public comment period, the volume-weighted average price of BTC only moved 0.7%, from $8010 to $8069; when the SEC postponed the VanEck/SolidX ETF proposal and requested additional comments on the proposal, the volume-weighted average price of BTC only move 0.3%, from $7910 to $7936. This may suggest that, despite the substantial “hype” around Bitcoin ETF approval, the market doesn’t care about a Bitcoin ETF as much as it cares, for instance, about BTC’s utility as a hedge against global markets. Alternatively — or additionally — the probability of ETF approval may have already been “baked into” market prices.
Individual exchange gaffes underscored the need of the crypto sector to continue maturing (May 7th & May 17th).
On May 7th, Binance announced that hackers had stolen 7000 BTC, or about $40 million, from them — though Binance was able to use its emergency insurance fund to prevent users’ funds from being affected, and BTC’s volume-weighted average price was minimally impacted. On the other hand, on May 17th, the price of BTC fell 10% from $8002.08 to $7191.58 — a “flash crash” that was broadly attributed to a below-market sell order of 5000 BTC for $6200 on Bitstamp. That the Binance hack didn’t crash BTC’s price demonstrates that the crypto market’s infrastructure has matured since the days of major hacks such as Mt. Gox — but the Bitstamp order shows that the market still has a ways to go in terms of a single exchange’s outsized impact on the asset class.
What to Watch in June 2019
Look to these events as potentially moving the volatility indices of BTC, ETH, BCH, LTC, BSV, and ETC in June:
Continued movement in trade relations and traditional markets.
If the thesis is correct that BTC traders are hedging against the S&P 500 and other global markets, then further news about trade relations could theoretically impact crypto as well.
Bitcoin 2019 in San Francisco (June 25th-26th).
While May was the major month for New York crypto conferences, this major conference on the west coast will bring together a diverse set of speakers including Edward Snowden, Tim Draper, Daniel Buchner, Jihan Wu, and Lily Liu. While New York is the historic center of finance, Silicon Valley has had a keen interest in crypto for a long time, so this conference could have a potentially high impact.
CME BTC futures last-trade date and BitMEX XBTM19 expiration date (June 28th).
Crypto volatility typically moves around the time of futures expirations. With CBOE having backed off from BTC futures for the time being, the date of CME and BitMEX’s futures expirations may potentially impact volatility more than usual.
Get the SFOX edge in volatile times through our proprietary algorithms directly from your SFOX account.
The Details: May 2019 Crypto Price, Volatility, and Correlation Data
Price Performance: A Steady Surge
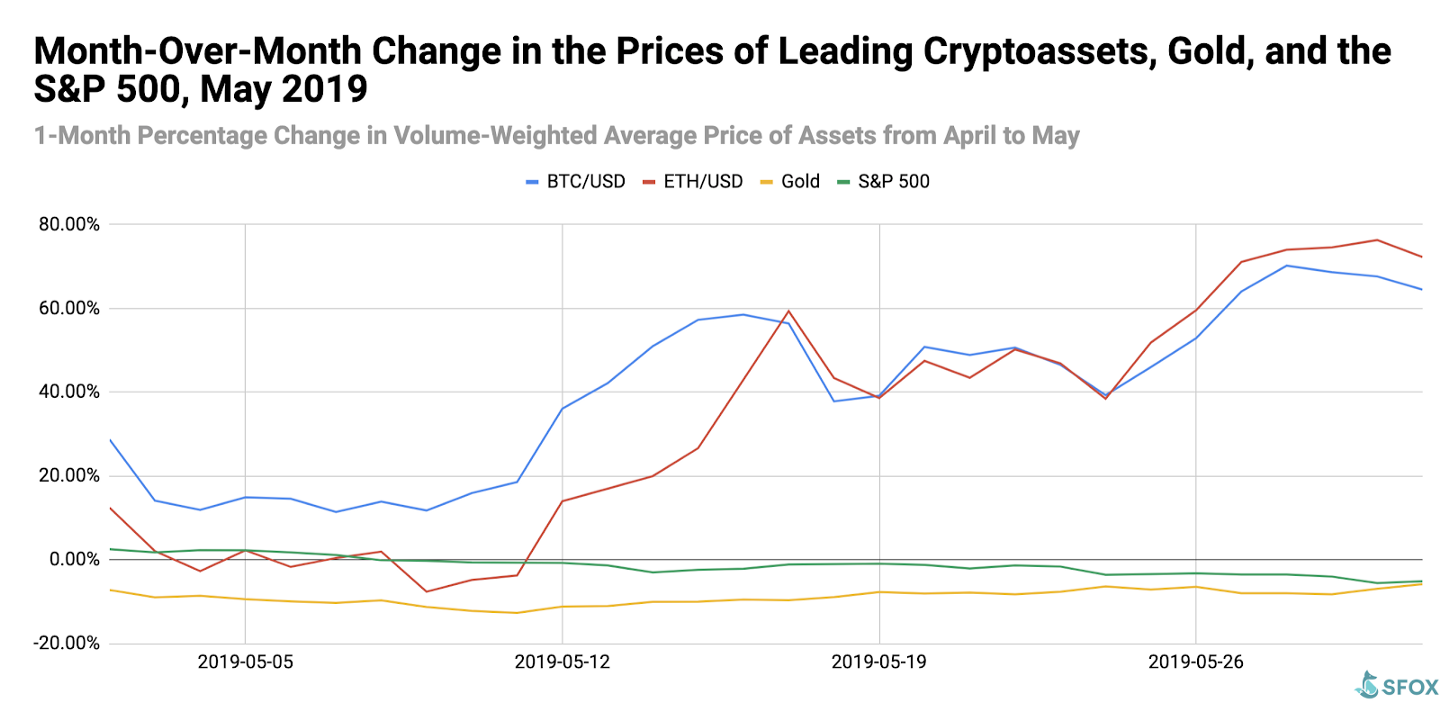
BTC opened the month of May at $5306.16. It closed the month at $8350.13, representing an increase of over 57%. Every cryptoasset tracked by this report closed May with positive month-over-month growth, whereas gold and the S&P 500 closed the month down from April.
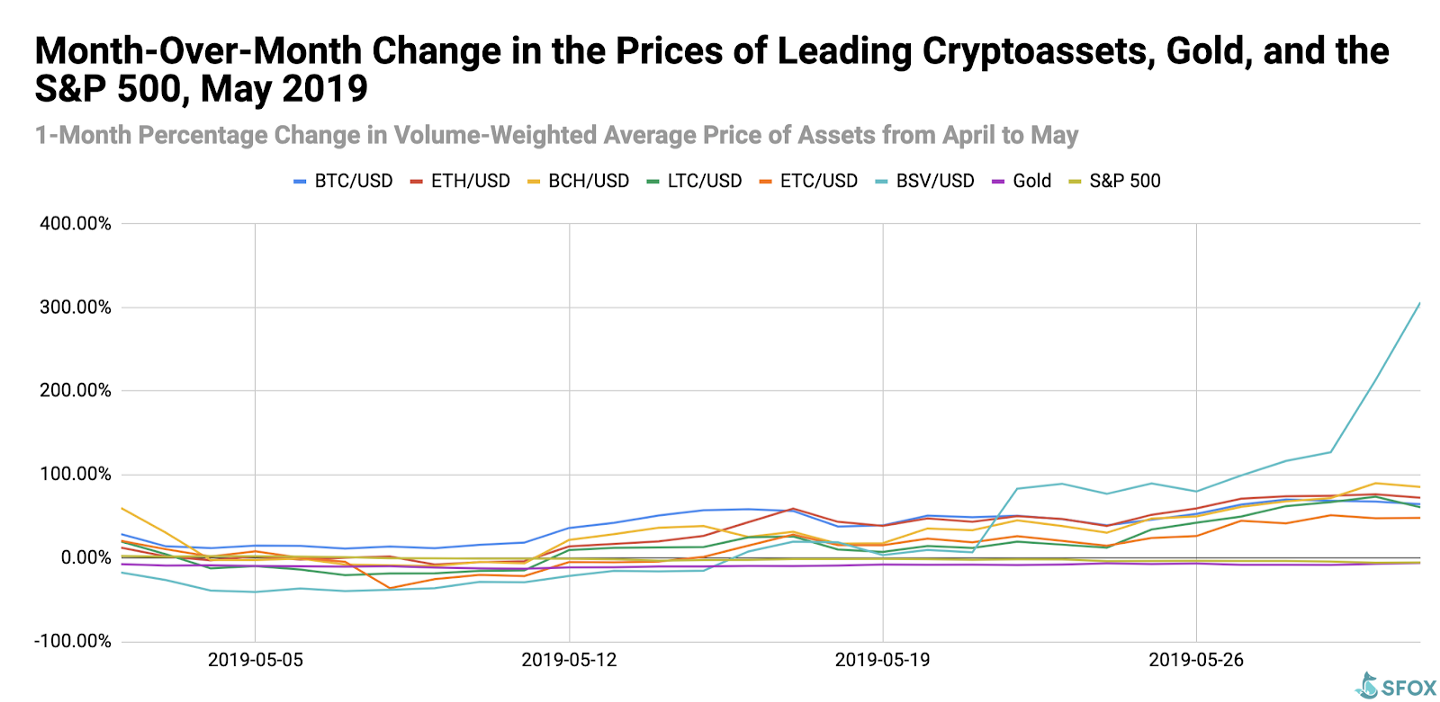
For greater graphical clarity, see this additional chart tracking only the month-over-month changes in the prices of BTC, ETH, gold, and the S&P 500:
Volatility: A Gradual Climb
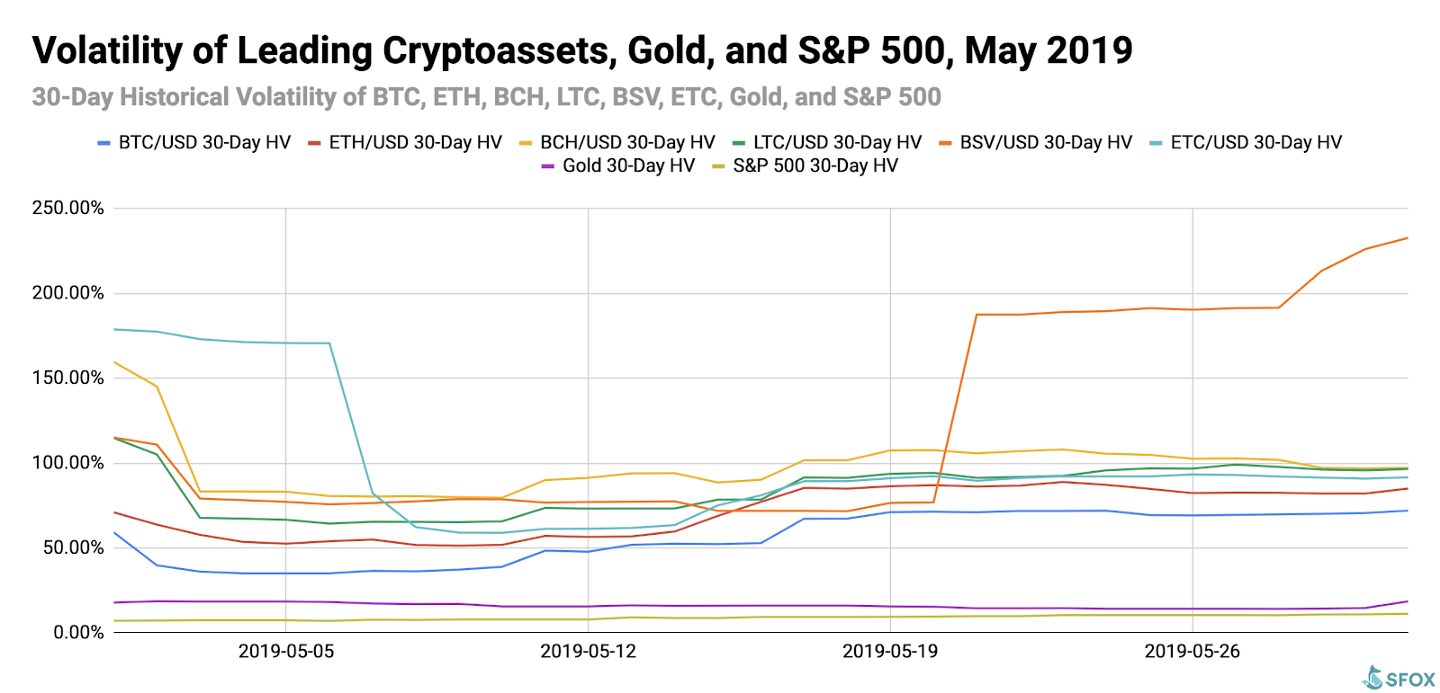
By looking at the 30-day historical volatilities of BTC, ETH, BCH, LTC, BSV, and ETC, we see that the crypto sector’s overall volatility increased over the course of the month, especially following news of Chinese-U.S. tariffs in the middle of the month.
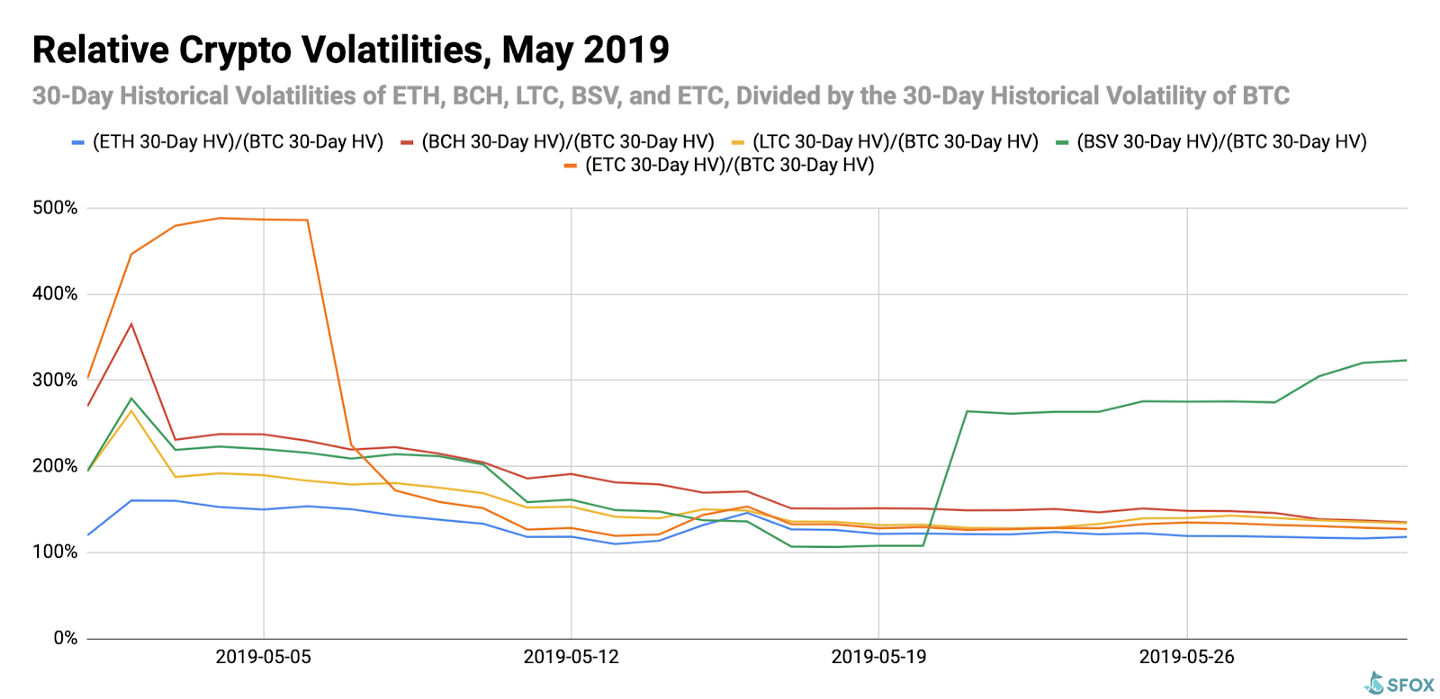
By looking at the 30-day historical volatilities of ETH, BCH, LTC, BSV, and ETC as a percentage of BTC’s 30-day historical volatility, we can see that most altcoins’ volatility moved in line with BTC’s, becoming more closely aligned as the month went on. The one outlier here was Bitcoin SV, which became much more volatile later in the month amid renewed debate about whether or not Craig Wright, outspoken BSV developer and supporter, was Satoshi Nakamoto.
Price Correlations: Bitcoin vs. the S&P 500
BTC’s 30-day price correlations with all other measured cryptocurrencies (ETH, BCH, and LTC) closed the month as highly positive (i.e. close to 1). In contrast, BTC has an unusually strong negative correlation (i.e. close to -1) with the S&P 500.
For a full crypto correlations matrix, see the following chart:
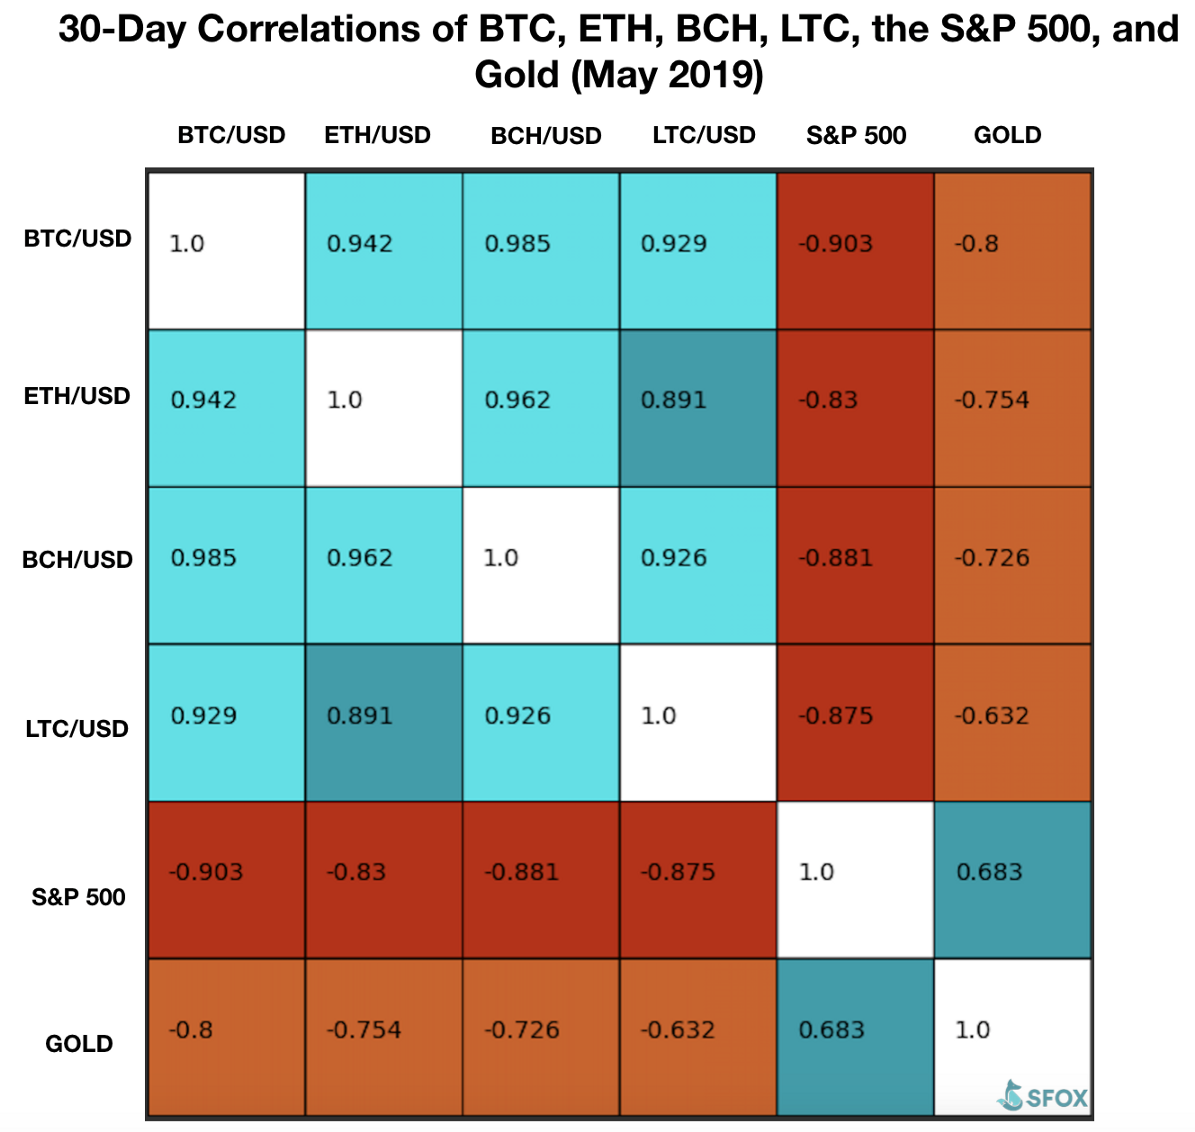
As discussed in the earlier analysis, the movement of BTC / altcoin correlations towards 1 in conjunction with the movement of BTC / S&P 500 correlation towards -1 suggest that some investors may be viewing BTC as a hedge against tumultuous global markets.

Appendix: Data Sources, Definitions, and Methodology
We use two different in-house volatility indices in creating these reports:
1. 30-day historical volatility (HV) indices are calculated from daily snapshots over the relevant 30-day period using the formula:
30-Day HV Index = σ(Ln(P1/P0), Ln(P2/P1), …, Ln(P30/P29)) * √(365)
2. Daily historical volatility (HV) indices are calculated from 1440 snapshots over the relevant 24-hour period using the formula:
Daily HV Index = σ(Ln(P1/P0), Ln(P2/P1), …, Ln(P1440/P1439))* √(1440)
S&P 500 performance data are collected from Yahoo! Finance using GSPC (S&P 500 Index) data. Gold performance data are collected from Yahoo! Finance using XAU (Philadelphia Gold and Silver Index) data.
The cryptoasset data sources aggregated for crypto prices, correlations, and volatility indices presented and analyzed in this report are the following eight exchanges, the order-book data of which we collect and store in real time:
- bitFlyer
- Binance
- Bitstamp
- Bittrex
- Coinbase
- Gemini
- itBit
- Kraken
Our indices’ integration of data from multiple top liquidity providers offers a more holistic view of the crypto market’s minute-to-minute movement. There are two problems with looking to any single liquidity provider for marketwide data:
- Different liquidity providers experience widely varying trade volumes. For example: according to CoinMarketCap, Binance saw over $20 billion USD in trading volume in November 2018, whereas Bitstamp saw $2 billion USD in trading volume in that same time — an order-of-magnitude difference. Therefore, treating any single liquidity provider’s data as representative of the overall market is myopic.
- Liquidity providers routinely experience interruptions in data collection. For instance, virtually every exchange undergoes regularly scheduled maintenance at one point or another, at which point their order books are unavailable and they therefore have no market data to collect or report. At best, this can prevent analysts from getting a full picture of market performance; at worst, it can make it virtually impossible to build metrics such as historical volatility indices.
Building volatility indices that collect real-time data from many distinct liquidity providers mitigates both of these problems: collecting and averaging data from different sources prevents any single source from having an outsized impact on our view of the market, and it also allows us to still have data for analysis even if one or two of those sources experience interruptions. We use five redundant data collection mechanisms for each exchange in order to ensure that our data collection will remain uninterrupted even in the event of multiple failures.
The above references an opinion and is for informational purposes only. It is not intended as and does not constitute investment advice, and is not an offer to buy or sell or a solicitation of an offer to buy or sell any cryptocurrency, security, product, service or investment. Seek a duly licensed professional for investment advice. The information provided here or in any communication containing a link to this site is not intended for distribution to, or use by, any person or entity in any jurisdiction or country where such distribution or use would be contrary to law or regulation or which would subject SFOX, Inc. or its affiliates to any registration requirement within such jurisdiction or country. Neither the information, nor any opinion contained in this site constitutes a solicitation or offer by SFOX, Inc. or its affiliates to buy or sell any cryptocurrencies, securities, futures, options or other financial instruments or provide any investment advice or service.


