Summary:
- The SFOX Multi-Factor Market Index is set at moderately bearish entering 2019.
- ETH, BCH, and LTC ended the year near their year-long highs for 30-day historical volatility — i.e. their 30-day historical volatilities on December 31st were near the highest values they had been throughout all of 2018. BTC’s 30-day historical volatility on December 31st fell in the 58th percentile for its values throughout all of 2018.
- BTC, ETH, BCH, and LTC maintain strong, positive correlations with each other; they are largely uncorrelated with the S&P 500, and slightly negatively correlated with gold.
- All SFOX-enabled cryptoassets were more volatile than the S&P 500 and gold throughout the year, with the exception of four days in November during which gold was more volatile than BTC.
- “FUD” (fear, uncertainty, and doubt) likely drove volatility in many forms throughout 2018, including: fear of market conditions; uncertainty about the evolving regulatory landscape; and doubt about how much the crypto sector has really developed thus far.
- Look to new ICOs, the U.S. economy, speculation about new products, and global crypto adoption statistics as potential drivers of volatility in 2019.
To usher in the new year, the SFOX Research Team is pleased to offer this review of the 2018 crypto market’s volatility. We’ve aggregated price, volume, and volatility data from eight major exchanges and liquidity providers to analyze the global performance of the 4 leading cryptoassets — BTC, ETH, BCH, and LTC — that we have enabled on our trading platform. The following is a report and analysis of their volatility throughout last year, with a focus on the last month of December. (For more information on data sources and methodology, please consult the appendix at the end of the report.)
The Current State of Crypto: Risk and Volatility Entering January 2019
Based on our calculations and analyses, the SFOX Multi-Factor Market Index, which we are debuting as a measure of current crypto market conditions, is set at moderately bearish as we enter 2019.
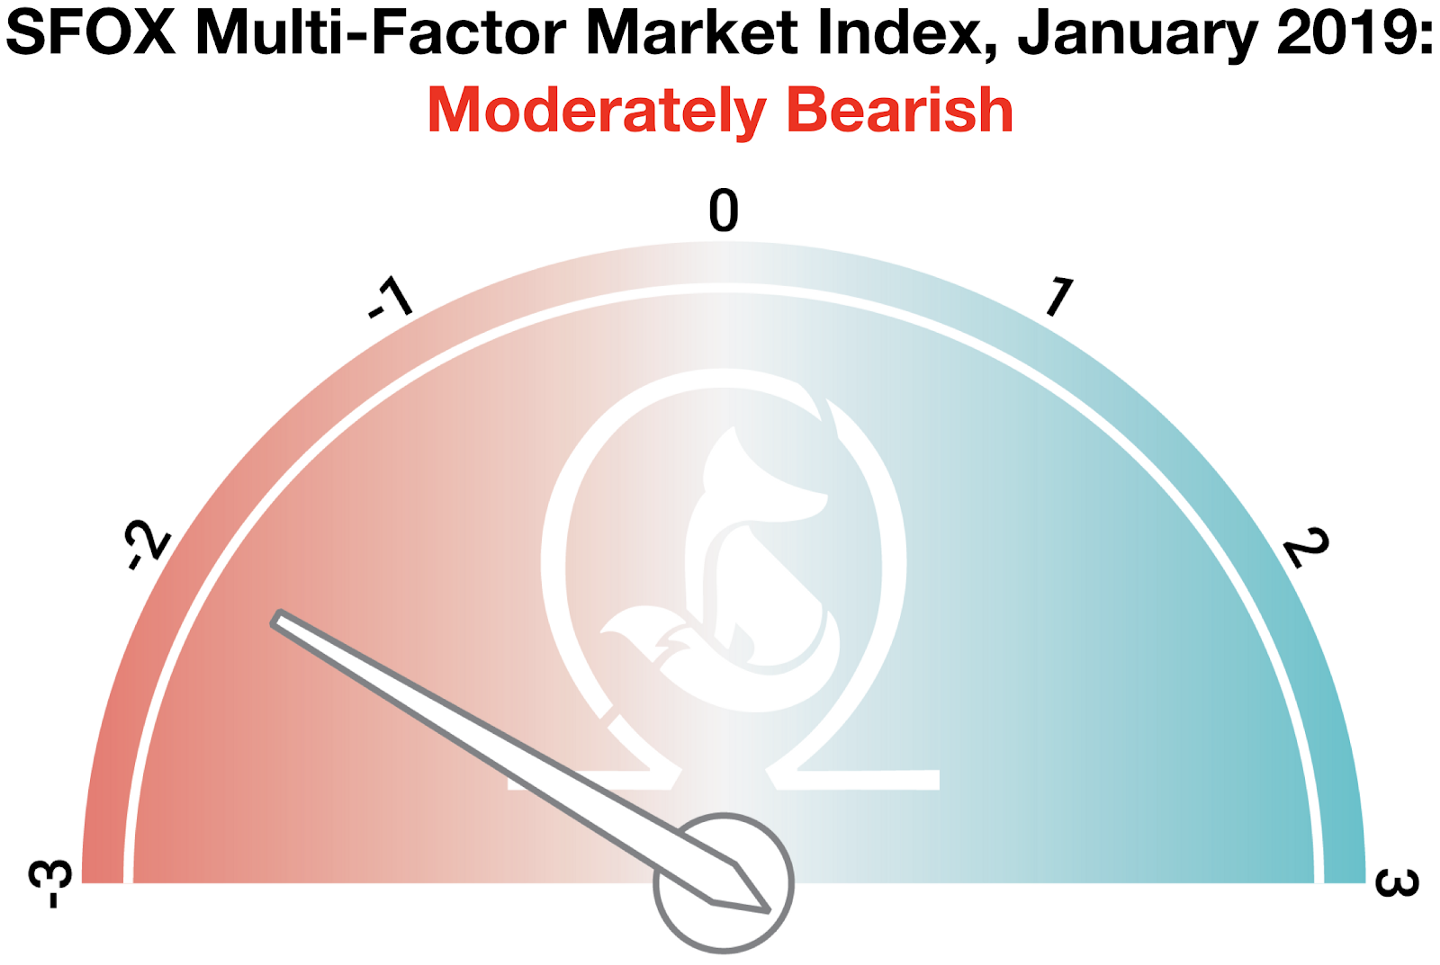
We calculate this index by using proprietary methods of quantifying and analyzing three factors: volatility, market sentiment, and continued advancement of the sector. The index ranges from highly bearish to highly bullish.
Three of SFOX’s top four cryptoassets closed 2018 near their peak level of volatility for the entire year, with BTC as the one outlier. Consult this graph for the December 31st 30-day historical volatilities of BTC, ETH, BCH, and LTC as percentiles of their volatility throughout the entire year of 2018:

While volatility doesn’t inherently warrant avoiding an asset class, it does contribute to the risk of entering or trading that asset class.
In terms of market sentiment, the overall public interest in crypto has dissipated largely over the course of 2018, though interest has grown moderately since the uptick in crypto volatility in the last two months. Those who remain engaged are fairly uncertain of whether the crypto market has bottomed out yet — and that uncertainty can contribute to volatility (and, consequently, to risk).
While public discussion about crypto has waned since the start of the year, we’re seeing sustained interest at SFOX from institutional investors who want exposure to crypto.
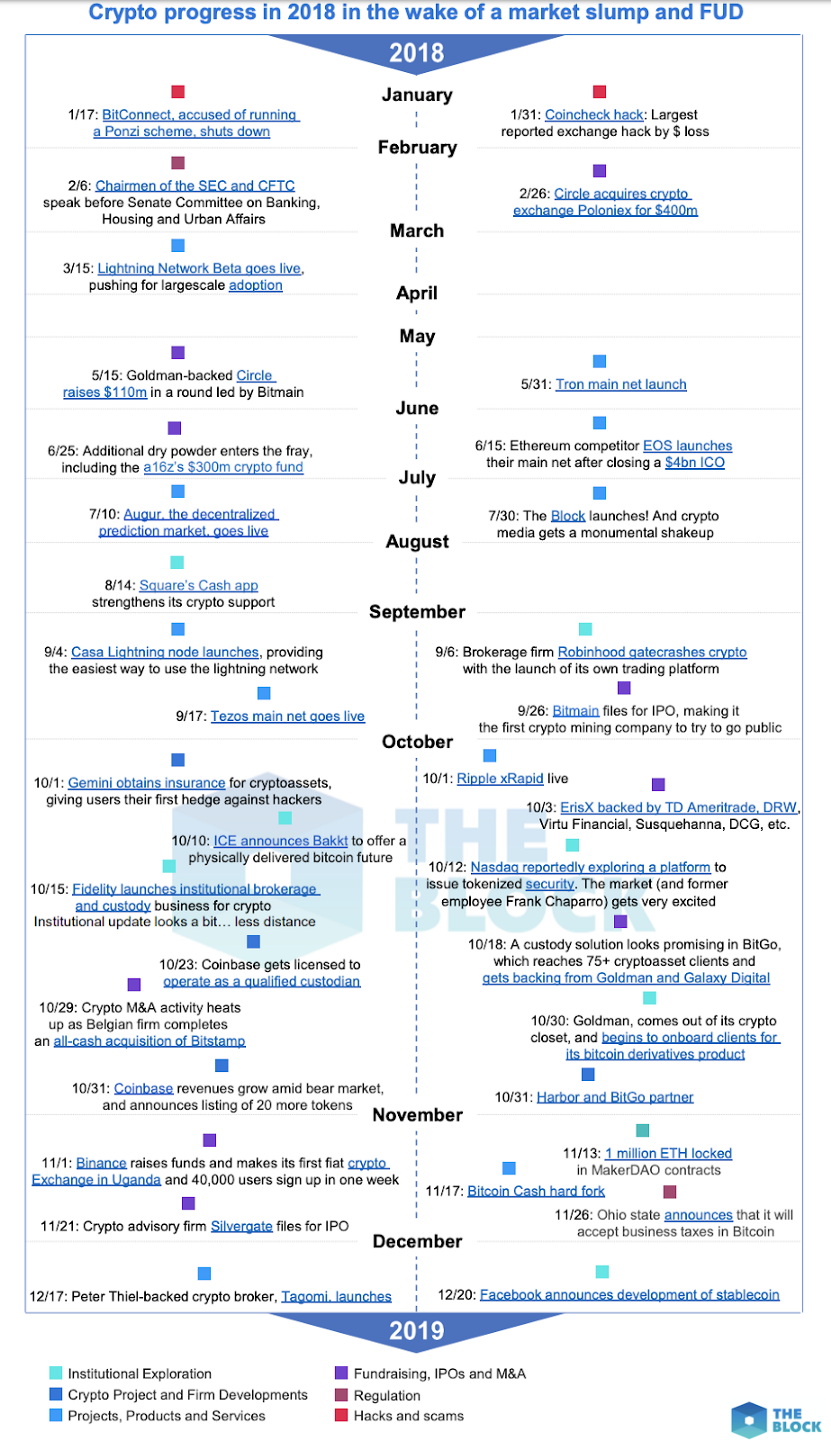
In terms of continued advancement of the sector, the end of the year saw all of the foundations and governmental entities behind SFOX’s leading four cryptocurrencies engaging with their communities, publishing new announcements, and preparing for the new year. While some developmental uncertainty remains in the wake of the recent Bitcoin Cash fork, the trend continues to be that infrastructure in the sector is developing in spite of the bear market, which gives some reason for cautious optimism. For some of those infrastructure highlights from throughout the year, see this timeline from The Block:
While SFOX’s leading cryptocurrencies did remain strongly correlated with each other in December 2018, they weren’t perfectly correlated with each other — notably, the BTC/USD and ETH/USD pairs only saw a 0.808 30-day correlation with one another. BTC, ETH, BCH, and LTC all saw relatively little correlation with the S&P 500 and low-to-moderate negative correlations with gold, which may potentially make these cryptoassets an effective hedging tool in portfolios going into 2019.
For a full crypto correlations matrix, see the following chart:
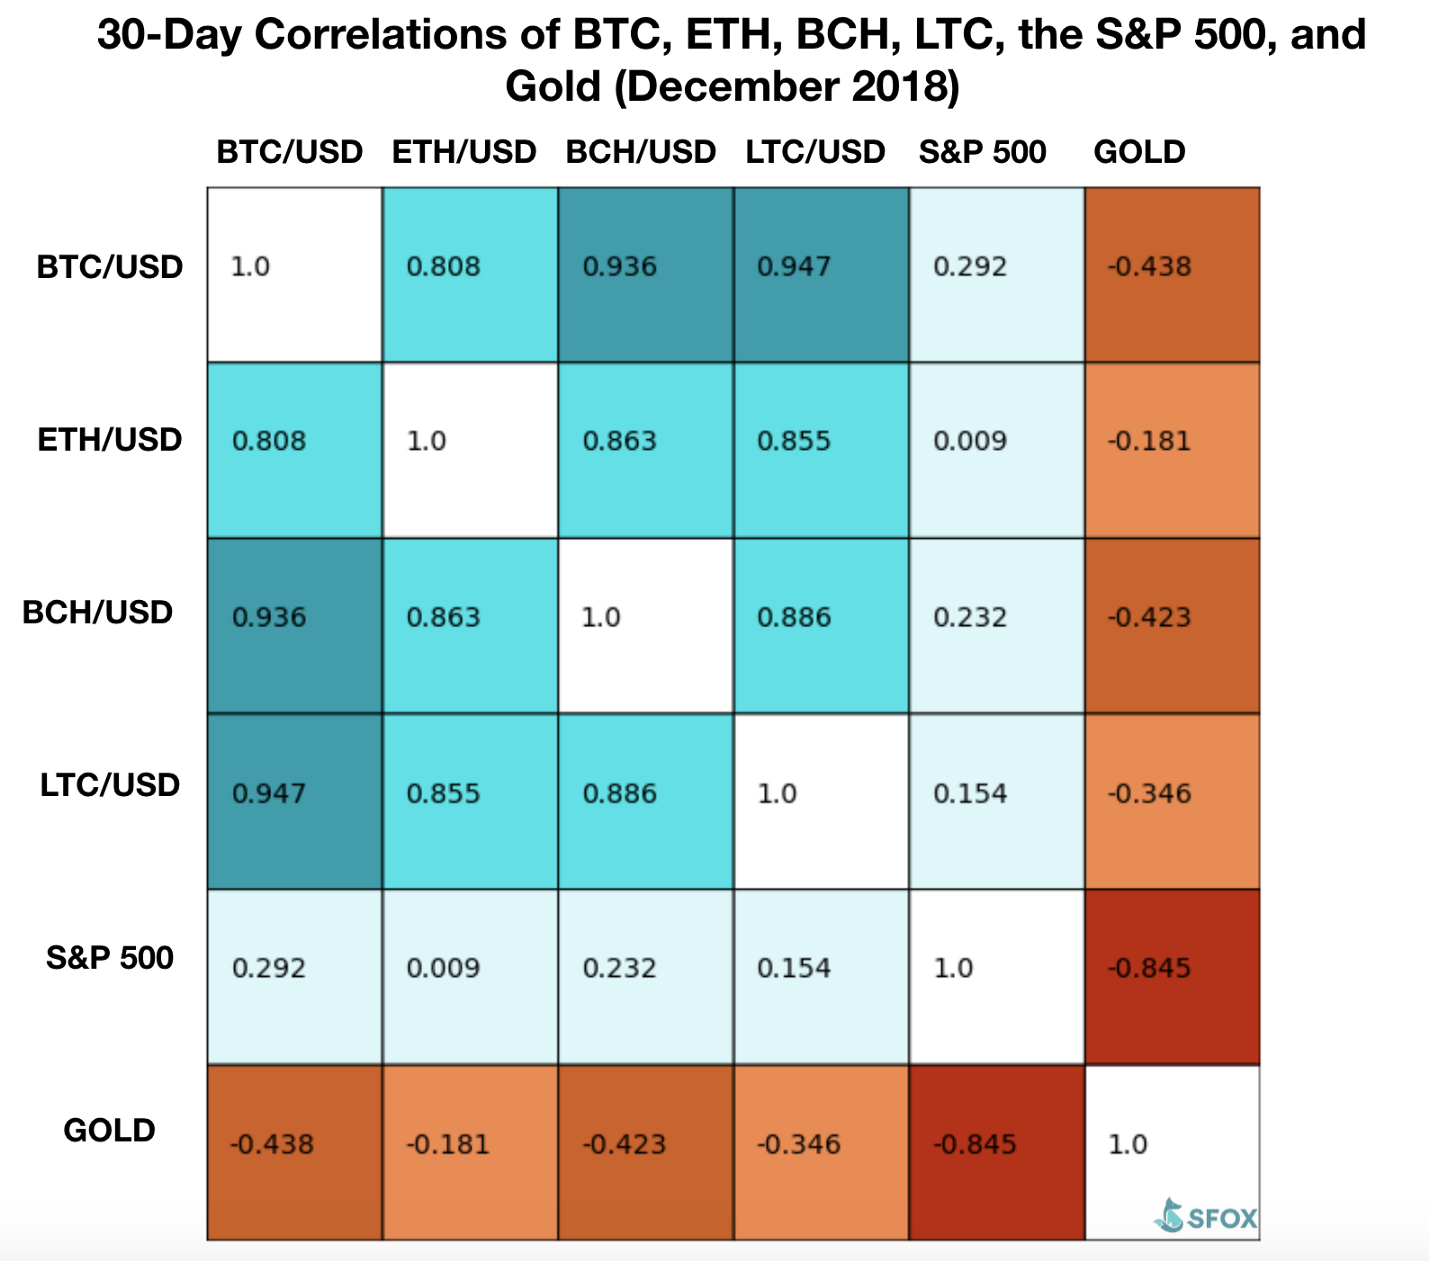
A graph of those 30-day correlations over the past year shows that there has been a decent amount of fluctuation — even within the crypto sector, where many are quick to say that “everything moves with BTC.”

🎢 2018 Overview: The Fall and Rise of Crypto Volatility
If the story of 2017 was upward movement in the crypto sector, then the story of 2018 was largely downward movement: Bitcoin showed the most dramatic price movement, peaking at $16,875 USD in January and closing out the year at $3,744 USD.
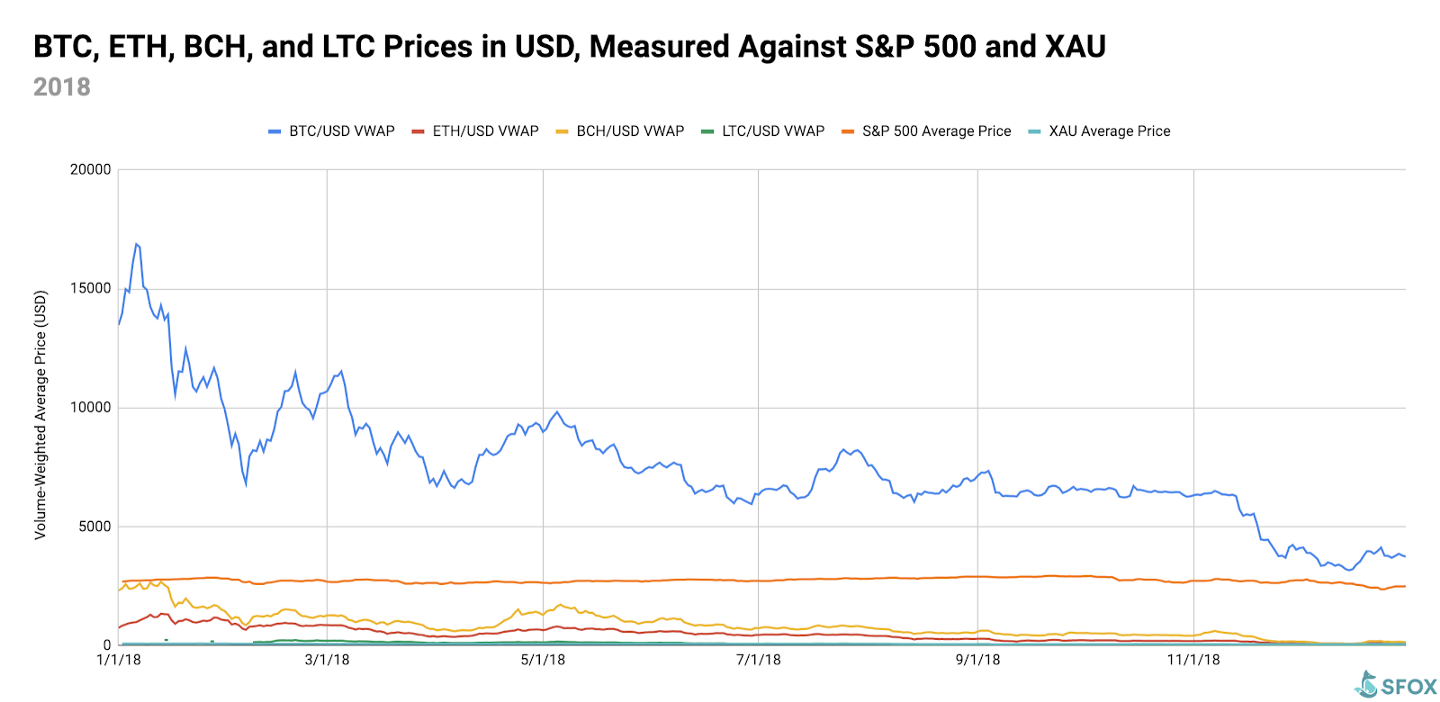
For greater graphical clarity, see this additional chart omitting BTC and the S&P 500 from the data set:
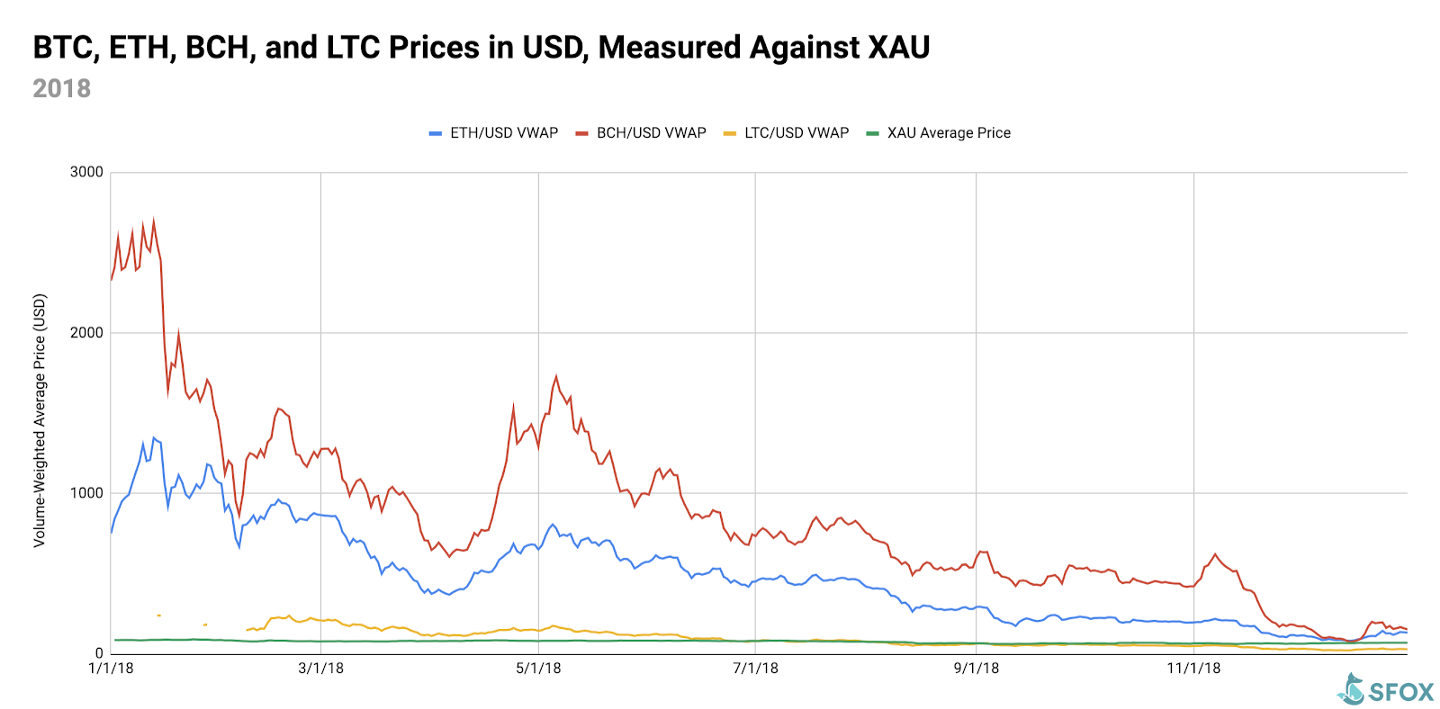
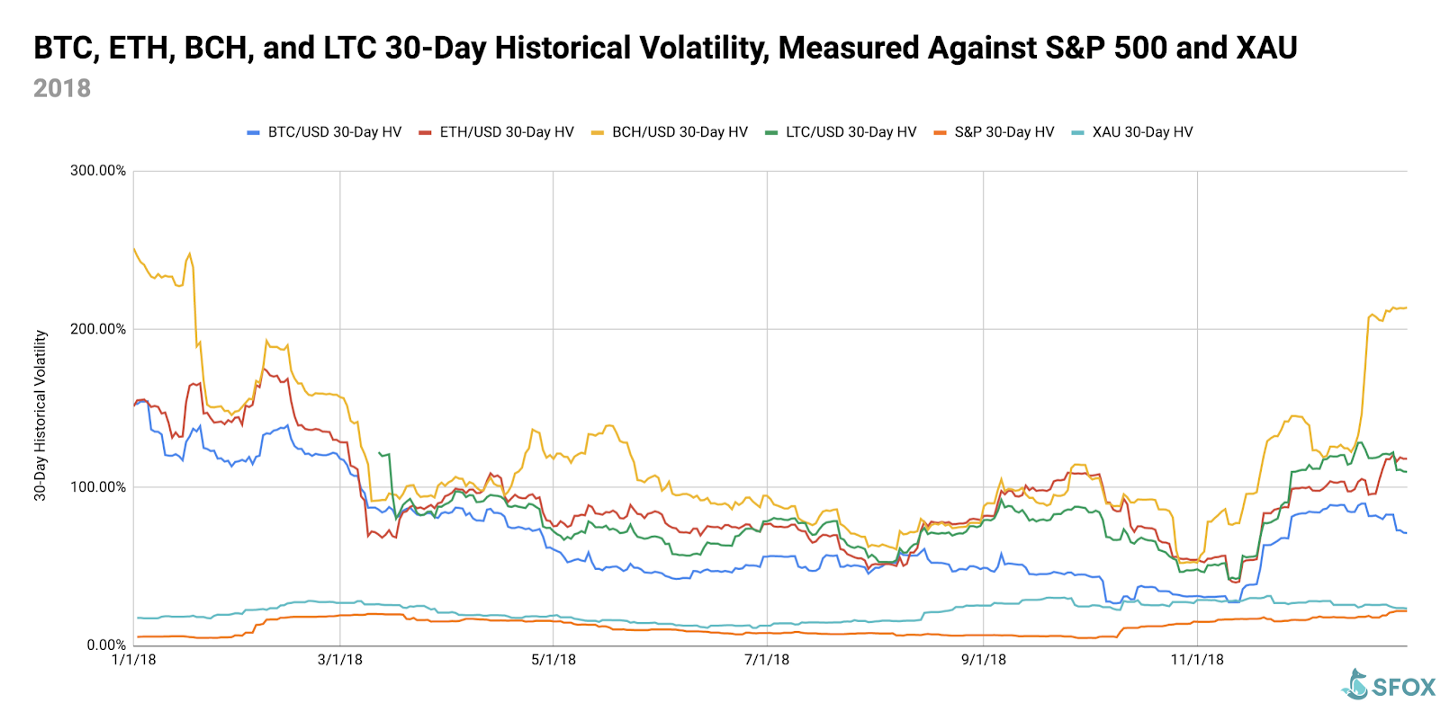
However, the decline in crypto prices wasn’t a steady one: 2018 also saw the volatility of cryptoassets, initially high, decrease throughout the year until this past November, at which point the trend began to reverse.
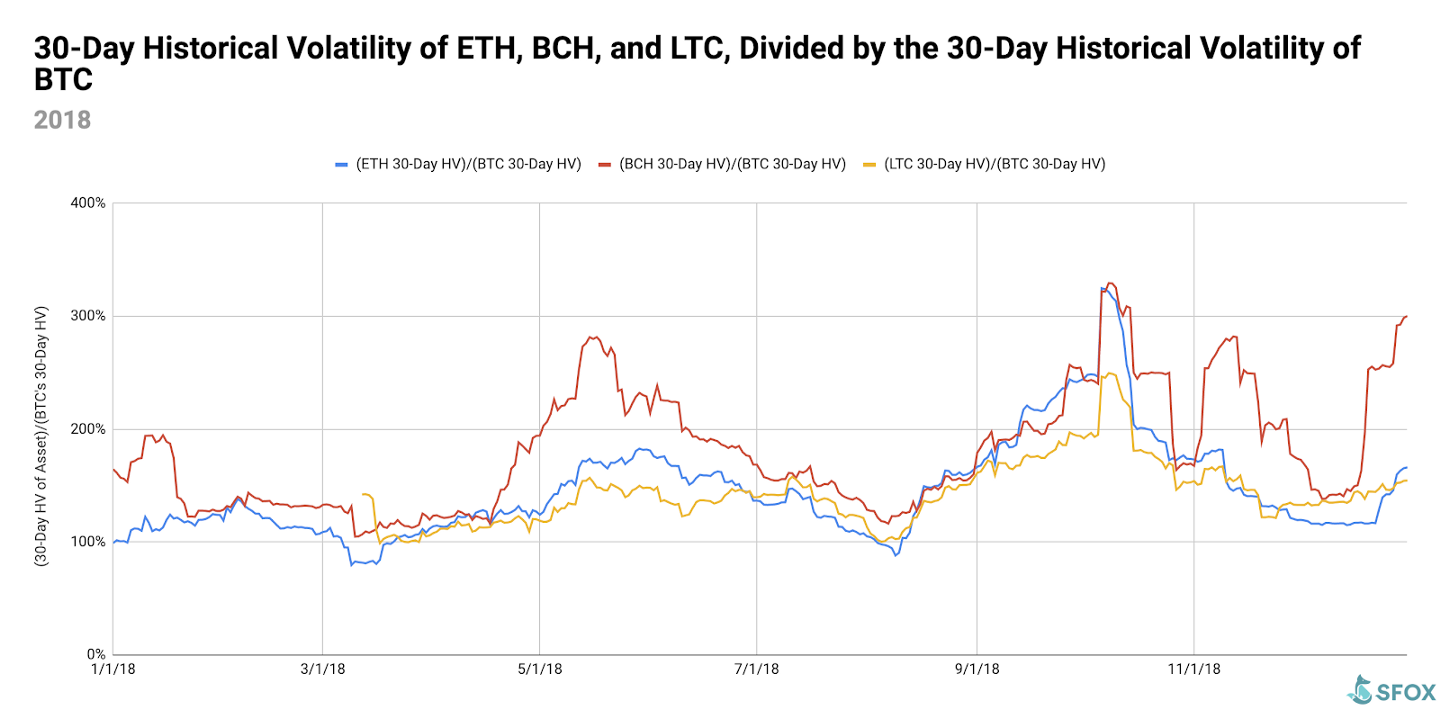
Analysis of 2018 Crypto Volatility
There were three intervals during which marketwide crypto volatility increased in 2018: early through mid-February, mid-August through September, and mid-November through mid-December.
Late January through mid-February: The end of January was marked by upheaval as many factors coalesced to depress the crypto market: hackers stole $500 million USD worth of NEM from Japan-based Coincheck; Facebook and China took steps to prevent their populations from being exposed to crypto-related websites and advertisements; and concerns were raised that Bitfinex and Tether might have been manipulating the price of BTC during 2017’s year-end rally. Between January 28th and February 6th, the price of BTC dropped from $11,670 USD to $6,828 USD. After the CFTC and SEC chairmen spoke before the Senate Banking Committee, the price of BTC and other cryptoassets began to rebound, peaking at a price of $11,477 USD for 1 BTC on February 20th. All told, this flurry of uncertainty following the end of December 2017’s crypto pump drove the 30-day historical volatility of BTC up from 117% on January 28th to a peak of 139% on February 17th, with other leading cryptoassets following suit.
Mid-August through September: Crypto prices generally continued to trend downward in this period — most likely, again, due to a confluence of events. August was colored by the SEC first postponing Bitcoin ETF decisions on the 8th and then rejecting nine Bitcoin ETF proposals on the 22nd, citing concerns about possible market manipulation and lack of regulatory oversight. Coinbase CEO Brian Armstrong added to this uncertainty by emphasizing in an August 15 Bloomberg interview that the crypto market may be much less developed and on a much longer trajectory to mainstream adoption than some people realize. And as if to demonstrate the youth and manipulability of the market, it’s hypothesized that the market dip at the beginning of September was the result of a single entity unloading about $1 billion USD worth of BTC onto the market from a wallet that hadn’t been used since 2014. The effects of these events were seen most prominently in altcoins like ETH and LTC: while BTC saw relatively small volatility spikes between August 1st and September 6th, ETH’s 30-day historical volatility climbed from 52% to 98%, while LTC’s 30-day historical volatility climbed from 56% to 92%.
Mid-November through early December: As we detailed in the SFOX November 2018 volatility report, marketwide crypto volatility began climbing again on November 14th, ahead of the Bitcoin Cash fork that gave birth to Bitcoin SV. The main factors here were (1) uncertainty about the outcome of the openly hostile fork and ensuing hash war between BCH and BSV, (2) the SEC announcing settlements with two major ICOs, and (3) reassurances from industry leaders about the staying power of BTC and other cryptoassets. Since the first week of December, most of the leading cryptoassets on SFOX have balanced out in terms of volatility — with one notable exception.
Bitcoin Cash was a standout in terms of its volatility levels, especially at the end of the year. Compare BCH’s BTC-relative 30-day historical volatility (in red) to that of ETH (in blue) and LTC (in yellow) throughout November and December 2018:
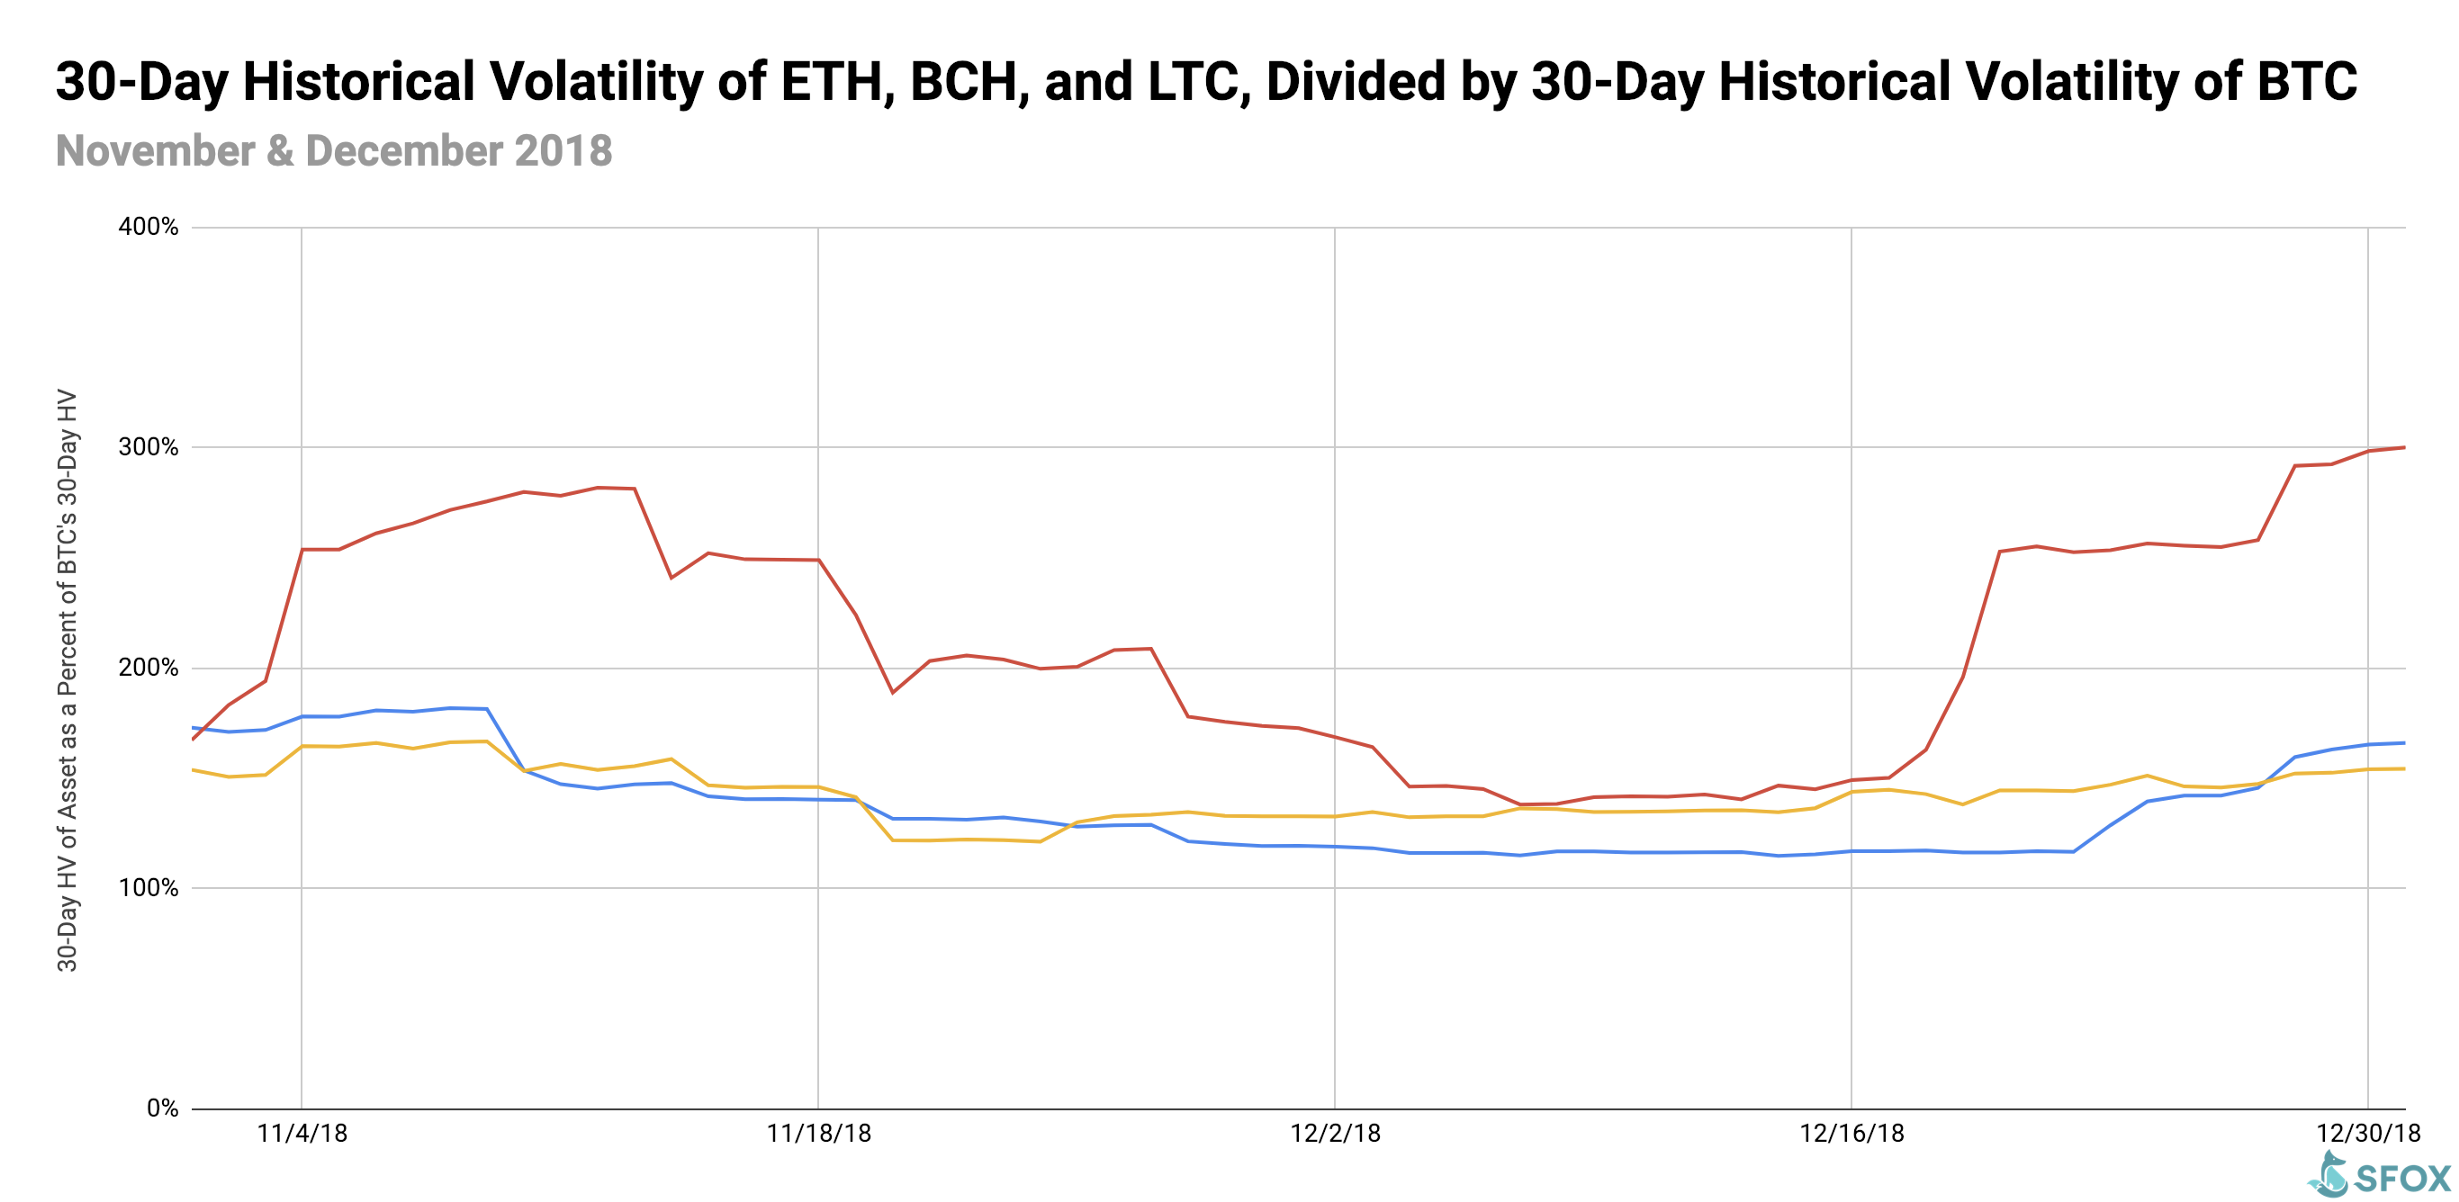
Not only is BCH’s BTC-relative volatility much higher than ETH’s and LTC’s: it also fluctuates much more than theirs. Why is this the case? While the answer isn’t totally clear, we favor the analysis that we first put forward in our article on Bitcoin SV:
It’s probably the case that groups argue over the “true vision” of what Bitcoin is and ought to be because Bitcoin remains the leading cryptocurrency by far, responsible for over half of the total crypto market cap. That means that Bitcoin has a special significance in the young crypto sector. Not only was it the progenitor of the modern crypto market: it’s also the most widely used and recognized cryptocurrency, the one that serves as many people and institution’s first exposure to blockchain technology.
For these reasons, many are concerned with whether the substance of Bitcoin accurately reflects its vision and promise. It’s what’s led outspoken Bitcoin Cash evangelists like Roger Ver to insist that Bitcoin Cash is “the real Bitcoin,” and it’s what’s led the Bitcoin SV community to literally include “Satoshi Vision” in their name.
As it remains unclear how much of the “Bitcoin empire” smaller chains like Bitcoin Cash and Bitcoin SV will be able to lay claim to in the long-run, uncertainty will, in theory, breed higher volatility — and that seems to be exactly what we’ve seen thus far, especially in the time immediately preceding and following the November fork.
What to Watch in 2019
Look to these events as potentially moving the volatility indices of BTC, ETH, BCH, and LTC in the coming year:
- Watch for the next wave of ICOs to impact Ethereum and ETH. 2017 was the “wild west” of unregulated ICOs; 2019 could usher in the next wave of regulated ICOs that are explicitly compliant with the SEC, which could lead to an uptick in ETH’s volatility.
- Watch the stock market and global economy for signs of a recession. According to a Duke survey, 48.6% of U.S. CFOs believe that the national economy will be in a recession by the end of 2019. Given crypto’s lack of correlation with the stock market, a recession could prompt more demand — and, consequently, more volatility — in the crypto sector, especially in the case of BTC.
- Watch for speculation about new products. We saw that speculation about Bitcoin ETFs was a significant factor in volatility this year; if the ETF specter rears its head again, or if similar sorts of speculation about new crypto instruments emerge, we could potentially see concomitant shifts in volatility.
- Keep an eye on statistics and factors contributing to actual adoption of cryptoassets — both on the individual and institutional levels. To some extent, the story of 2017 and 2018 crypto is one of extreme hype rising and then subsiding; the biggest influencers of 2019 may well end up being advances made in getting communities and institutions to actually use this technology.
Use the SFOX edge in volatile times through our proprietary algorithms directly from your SFOX account.
Appendix: Data Sources, Definitions, and Methodology
We use two different in-house volatility indices in creating these reports:
1. 30-day historical volatility (HV) indices are calculated from daily snapshots over the relevant 30-day period using the formula:
30-Day HV Index = σ(Ln(P1/P0), Ln(P2/P1), …, Ln(P30/P29)) * √(365)
2. Daily historical volatility (HV) indices are calculated from 1440 snapshots over the relevant 24-hour period using the formula:
Daily HV Index = σ(Ln(P1/P0), Ln(P2/P1), …, Ln(P1440/P1439))* √(1440)
S&P 500 and XAU data are collected from Yahoo! Finance.
The cryptoasset data sources aggregated for the volatility indices presented and analyzed in this report are the following eight exchanges, the order-book data of which we collect and store in real time:
- bitFlyer
- Binance
- Bitstamp
- Bittrex
- Coinbase
- Gemini
- itBit
- Kraken
Our indices’ integration of data from multiple top liquidity providers provides a more holistic view of the crypto market’s minute-to-minute movement. There are two problems with looking to any single liquidity provider for marketwide data:
- Different liquidity providers experience widely varying trade volumes. For example, according to CoinMarketCap, Binance saw over $20 billion USD in trading volume over the last month, whereas Bitstamp saw $2 billion USD in trading volume — an order-of-magnitude difference. Therefore, treating any single liquidity provider’s data as representative of the overall market is myopic.
- Liquidity providers routinely experience interruptions in data collection. For instance, virtually every exchange undergoes regularly scheduled maintenance at one point or another, at which point their order books are unavailable and they therefore have no market data to collect or report. At best, this can prevent analysts from getting a full picture of market performance; at worst, it can make it virtually impossible to build metrics such as historical volatility indices.
Building volatility indices that collect real-time data from many distinct liquidity providers mitigate both of these problems: collecting and averaging data from different sources prevents any single source from having an outsized impact on our view of the market, and it also allows us to still have data for analysis even if one or two of those sources experience interruptions. We use five redundant data collection mechanisms for each exchange in order to ensure that our data collection will remain uninterrupted even in the event of multiple failures.
Readers should note that we have also enabled the trading of Bitcoin SV and Ethereum Classic on SFOX. We did not include them in this report because we only enabled them on our platform at the end of December 2018; we will be including them in future editions of the monthly volatility report.
The above references an opinion and is for informational purposes only. It is not intended as and does not constitute investment advice, and is not an offer to buy or sell or a solicitation of an offer to buy or sell any cryptocurrency, security, product, service or investment. Seek a duly licensed professional for investment advice. The information provided here or in any communication containing a link to this site is not intended for distribution to, or use by, any person or entity in any jurisdiction or country where such distribution or use would be contrary to law or regulation or which would subject SFOX, Inc. or its affiliates to any registration requirement within such jurisdiction or country. Neither the information, nor any opinion contained in this site constitutes a solicitation or offer by SFOX, Inc. or its affiliates to buy or sell any cryptocurrencies, securities, futures, options or other financial instruments or provide any investment advice or service.
